실험실 용량 및 생산 추적 템플릿
Managing a high-volume laboratory requires more than just technical expertise; it demands precise operational oversight to ensure that deadlines are met and resources are utilized efficiently.
이 대용량 실험실을 관리하려면 단순한 기술 전문성만으로는 부족합니다; 마감일을 지키고 자원을 효율적으로 활용하기 위해 정밀한 운영 관리가 필요합니다.
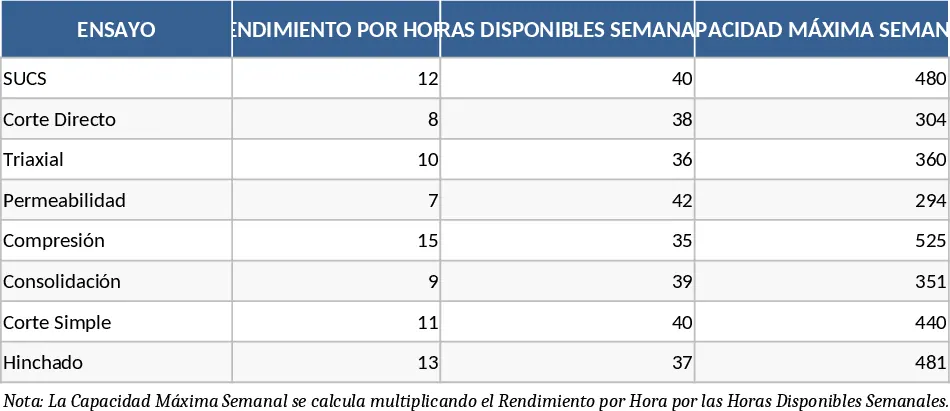
This Laboratory Capacity and Production Management template is designed to bridge the gap between technical testing and project management. It provides a structured framework to define your laboratory's true ceiling by calculating maximum weekly capacity based on specific test performance rates and available labor hours. By understanding your real-world limits, you can avoid the common pitfall of over-committing resources and failing to meet client expectations.
이 실험실 용량 및 생산 관리 템플릿은 기술 테스트와 프로젝트 관리를 연결하도록 설계되었습니다. 특정 시험 성능률과 가용 인력 시간을 기준으로 최대 주간 용량을 계산하여 실험실의 실제 한계를 정의하는 구조화된 프레임워크를 제공합니다. 현실적인 한계를 이해함으로써 자원을 과도하게 할당하고 고객 기대에 미치지 못하는 일반적인 함정을 피할 수 있습니다.
The template is organized into three core functional areas that streamline your daily workflow. The Configuration sheet allows you to input specific test types, such as SUCS, Direct Shear, or Triaxial tests, and define their hourly performance rates. This automatically calculates your weekly capacity based on your staff's working hours, giving you a realistic view of what your lab can handle. The Project sheet is where you define the scope of work, setting total programmed goals and timelines for specific clients or internal projects. Finally, the Weekly Production sheet serves as the heartbeat of your operations, where you record actual execution against weekly targets to monitor progress, calculate balances, and identify production gaps in real-time.
템플릿은 일일 작업 흐름을 간소화하는 세 가지 핵심 기능 영역으로 구성됩니다. Configuration 시트에서는 SUCS, Direct Shear, Triaxial 시험과 같은 특정 시험 유형을 입력하고 시간당 성능률을 정의할 수 있습니다. 이를 통해 직원 근무 시간을 기준으로 주간 용량을 자동으로 계산하여 실험실이 처리할 수 있는 현실적인 범위를 파악할 수 있습니다. Project 시트에서는 작업 범위를 정의하고 특정 고객 또는 내부 프로젝트에 대한 총 목표와 일정을 설정합니다. 마지막으로 Weekly Production 시트는 운영의 핵심으로, 주간 목표 대비 실제 실행을 기록하여 진행 상황을 모니터링하고 잔여량을 계산하며 실시간으로 생산 격차를 식별합니다.
This tool is indispensable for laboratory managers, project coordinators, and lead technicians who handle large-scale testing projects involving hundreds or thousands of samples. It solves the common problem of production bottlenecks by providing data-driven insights into production speed and completion projections. Instead of guessing when a project will finish, you can use the built-in formulas to see exactly how many weeks are remaining based on your current real-world velocity. It also helps you account for the non-testing phases of the lab cycle, such as drying times, saturation, and the final reporting phase, ensuring that your progress tracking reflects billable reality rather than just work-in-progress.
이 도구는 수백에서 수천 개의 샘플을 포함한 대규모 테스트 프로젝트를 담당하는 실험실 관리자, 프로젝트 코디네이터 및 수석 기술자에게 필수적입니다. 생산 속도와 완료 예측에 대한 데이터 기반 통찰을 제공함으로써 일반적인 생산 병목 현상을 해결합니다. 프로젝트 완료 시점을 추측하는 대신, 내장된 수식을 사용하여 현재 실제 속도에 기반한 남은 주수를 정확히 확인할 수 있습니다. 또한 건조 시간, 포화, 최종 보고 단계와 같은 비시험 단계도 고려하도록 도와주어 진행 상황 추적이 실제 청구 가능한 현실을 반영하도록 합니다.
Beyond simple tracking, the template helps you manage the nuances of laboratory work. The integrated dashboard concepts allow for visual monitoring of accumulated progress versus goals, using traffic-light indicators to highlight projects that require immediate attention. If your execution falls below 85% of the goal, the system flags it as a risk, allowing you to intervene before the project timeline is compromised. This level of visibility is crucial for maintaining high standards of service and operational excellence in a competitive testing environment.
단순 추적을 넘어, 템플릿은 실험실 작업의 미묘한 차이를 관리하도록 돕습니다. 통합 대시보드 개념을 통해 누적 진행 상황과 목표를 시각적으로 모니터링하고, 트래픽 라이트 지표로 즉각적인 주의가 필요한 프로젝트를 강조합니다. 실행률이 목표의 85% 이하로 떨어지면 시스템이 위험으로 표시하여 프로젝트 일정이 위협받기 전에 개입할 수 있게 합니다. 이러한 가시성은 경쟁이 치열한 테스트 환경에서 높은 서비스 수준과 운영 우수성을 유지하는 데 필수적입니다.
How to Use
- Set Your Capacity: Navigate to the Configuration sheet and enter your laboratory's specific tests, the average units completed per hour, and the total weekly hours available to establish your maximum capacity ceiling.
- Define Project Goals: In the Project sheet, enter the total number of tests required for a specific contract and the start/end dates; the template will automatically generate the ideal weekly production target needed to finish on time.
- Log Weekly Progress: Every week, input the number of tests actually executed. The template will automatically update the accumulated totals, remaining balance, and percentage of completion for each test type.
- Analyze and Adjust: Review the Difference and Compliance metrics to see if you are ahead or behind schedule. Use the Projection of Term formula to estimate the actual completion date based on your current production speed.
Expected Benefits
- Eliminate guesswork in project scheduling and resource allocation.
- Identify production bottlenecks before they cause significant delays.
- Improve client communication with accurate, data-backed progress reports and completion estimates.
사용 방법
- 용량 설정: Configuration 시트로 이동하여 실험실의 특정 시험, 시간당 평균 완료 단위, 그리고 사용 가능한 총 주간 시간을 입력해 최대 용량 상한을 설정합니다.
- 프로젝트 목표 정의: Project 시트에서 특정 계약에 필요한 총 시험 수와 시작/종료 날짜를 입력합니다; 템플릿이 자동으로 제때 완료하기 위한 이상적인 주간 생산 목표를 생성합니다.
- 주간 진행 상황 기록: 매주 실제 수행된 시험 수를 입력합니다. 템플릿이 자동으로 누적 합계, 남은 잔여량 및 각 시험 유형별 완료 비율을 업데이트합니다.
- 분석 및 조정: Difference 및 Compliance 지표를 검토하여 일정 앞서 있는지 뒤처지는지 확인합니다. 현재 생산 속도를 기반으로 Projection of Term 수식을 사용해 실제 완료 날짜를 추정합니다.
예상 효과
- 프로젝트 일정 및 자원 할당에서 추측을 없앱니다.
- 심각한 지연을 초래하기 전에 생산 병목 현상을 식별합니다.
- 정확하고 데이터 기반의 진행 보고서와 완료 추정치를 통해 고객 커뮤니케이션을 향상시킵니다.