度假租賃投資回報計算 模板
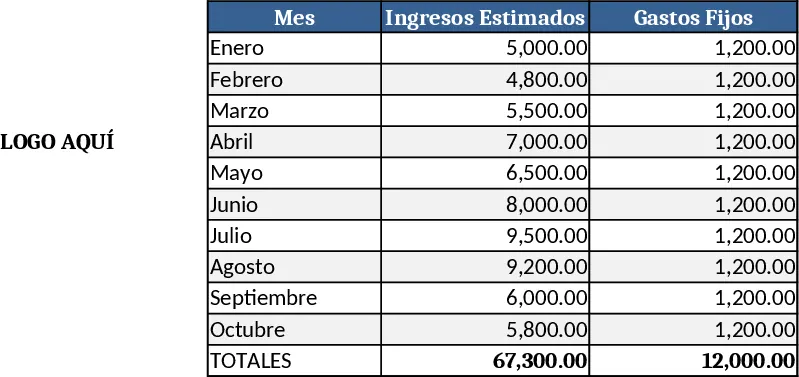
This Excel workbook is built around a single, easy‑to‑edit sheet that lets you model the financial performance of a vacation‑rental property. The left side of the sheet reserves a column for your own logo, giving the file a professional look. Below the logo, a dynamic table (minimum 7 rows × 10 columns) captures all the key inputs: purchase price, financing terms, monthly operating costs, seasonal occupancy rates, nightly rates, cleaning fees, and any additional income streams. Drop‑down lists let you select tax rates, financing options, or property types, while built-in formulas automatically compute monthly cash flow, annual net operating income, and the overall return on investment (ROI). A summary section at the top pulls these calculations into clear metrics – cash‑on‑cash return, payback period, and break‑even occupancy – displayed as numbers and simple charts.
The template solves the common headache of juggling multiple spreadsheets or manual calculations when evaluating a short‑term rental investment. By centralising all variables in one place, it lets you instantly see how changes in price, occupancy, or expenses affect profitability. This speeds up scenario analysis, helps you set realistic rental rates, and provides a professional report you can share with partners or lenders. The built‑in flexibility to add or delete rows and columns means the model grows with your portfolio, whether you manage a single cabin or a collection of properties.
Ideal for property owners, real‑estate investors, Airbnb hosts, and small‑scale hospitality managers, the workbook fits anyone who needs a quick, reliable way to forecast returns on a vacation‑rental purchase. It works especially well during the acquisition phase, when you compare multiple properties, and later when you monitor actual performance against your original projections.
How to use
- Open the file and replace the placeholder image with your own logo in the left‑most column.
- Fill in the input table with your property’s purchase price, loan details, expected nightly rates, occupancy percentages for each month, and all recurring costs.
- The workbook will instantly update the cash‑flow grid and the summary section; review the ROI, payback period, and break‑even charts to assess viability.
- Adjust any variable (e.g., increase the nightly rate or lower cleaning fees) and watch the impact on the key metrics in real time.
Expected benefits: reduces the time spent on manual calculations, streamlines scenario testing, and delivers a polished financial snapshot ready for decision‑making.