
Excel AI for Finance
Mastering Excel Data Visualization
Financial Data Visualization (FDV) changes that.
It transforms complex numbers into the strategic narrative that drives decision-making.
The Problem
Financial data is the lifeblood of business — but when trapped in dense, static Excel tables, its value is lost.
The Solution
Financial Data Visualization (FDV) transforms raw computation into executive-ready insight.
The Tool
RowSpeak AI, a specialized AI tool deeply integrated into your Excel workflow.


See the Whole Story, Not Just the Numbers
Traditional finance workflows suffer from three major bottlenecks — AI-powered visualization resolves them instantly.
Pain Point
- Data Overload
- Slow Reporting
- Interpretation Gap
Visual Solution
- Trends & outliers highlighted visually
- One-click automated dashboards
- Visual stories executives understand
Strategic Impact
- Faster anomaly detection
- Major time savings
- Better decisions
Powerful Insights Instantly
Transform your spreadsheets into powerful insights instantly.
Try RowSpeak FreeWhat is Financial Data Visualization and Why It's Non-Negotiable?
Financial Data Visualization (FDV) graphically represents P&L, Cash Flow, Budget vs Actual, and profitability ratios.
It is the highest form of financial communication — turning hours of interpretation into seconds of clarity.
In executive meetings:
 Tables support structured discussion
 - Visuals drive immediate consensus
Core FDV Goals: The Three Pillars of Visual Finance

Discovery
Uncover trends, seasonality, correlations, and risk factors hidden in raw spreadsheets.

Communication
Explain solvency, liquidity, and profitability clearly to both finance and non-finance stakeholders.

Decision Support
Compare Budget vs Actual, assess risk, and support forecasting through interactive visuals.
Overcoming Data Ingestion:
The Foundation of Good Visuals
Great visuals depend on clean, structured data.
Financial data often arrives fragmented — PDFs, scans, screenshots — blocking reliable visualization.

PDF → Excel

Image → Excel

Chat → Clean Data

Dashboard → Visual Output
RowSpeak AI:
Automating Data Readiness for Clean Charts
This eliminates the most common visualization failures before charts are even created.
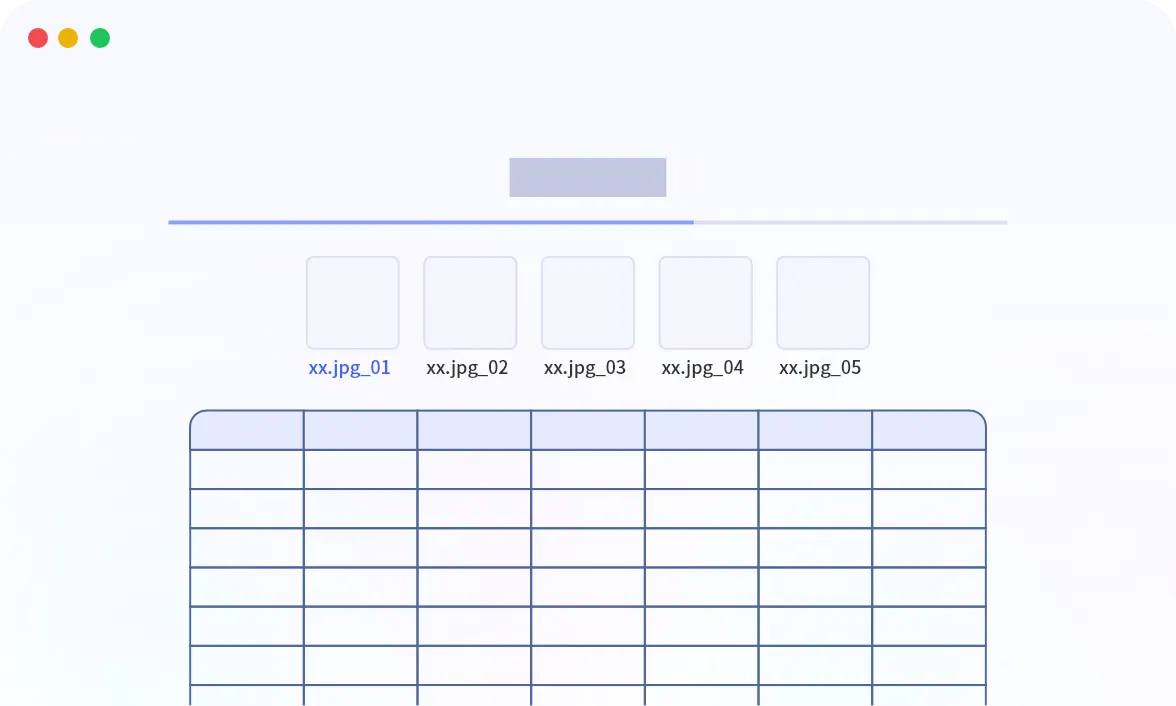
PDF to Excel / Image to Excel
Instantly extract structured financial data without manual entry.
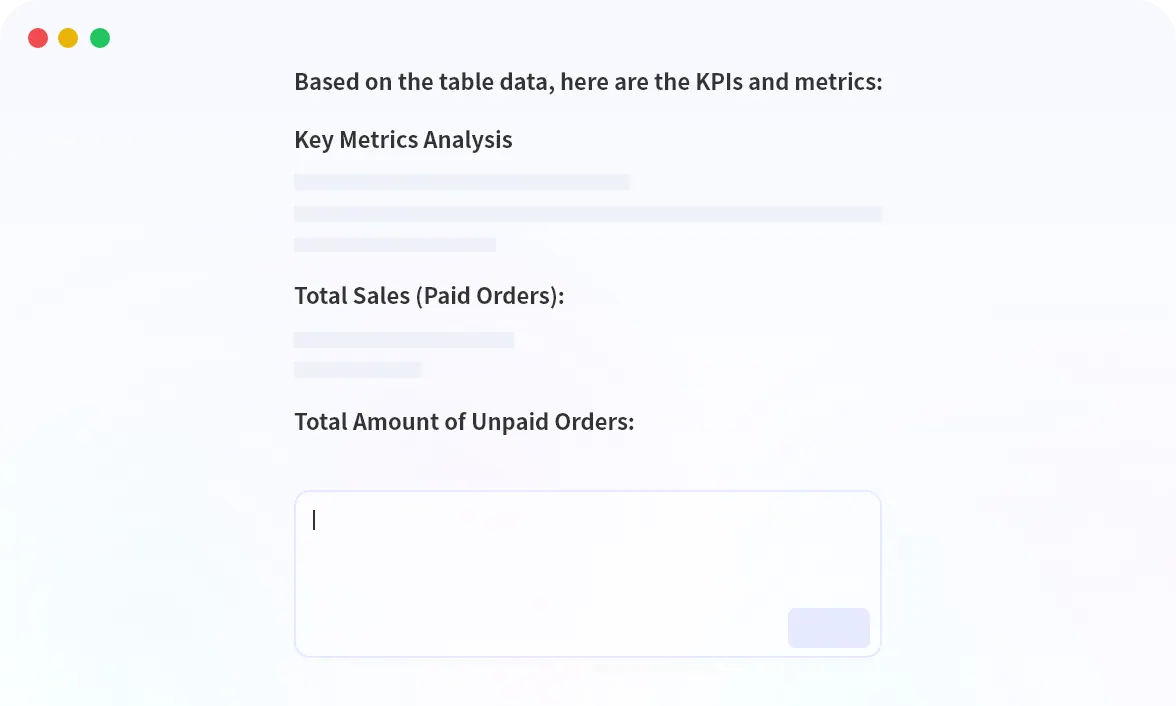
Chat With Excel
Ask for charts or tables in plain English — AI handles formulas and pivots.
The Power of Specialized Charts for Financial Storytelling
RowSpeak AI intelligently selects the right chart to communicate the right financial insight.
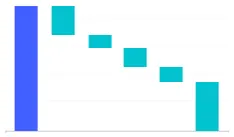
Waterfall Chart
Explain Net Income or Cash Flow changes clearly.
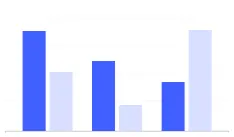
Diverging Bar Chart
Instantly show Budget vs Actual performance gaps.
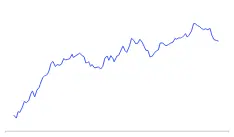
Line Chart
Visualize trends and predictive ranges for forecasting.

Heatmap
Highlight high-risk regions or low-margin products at a glance.
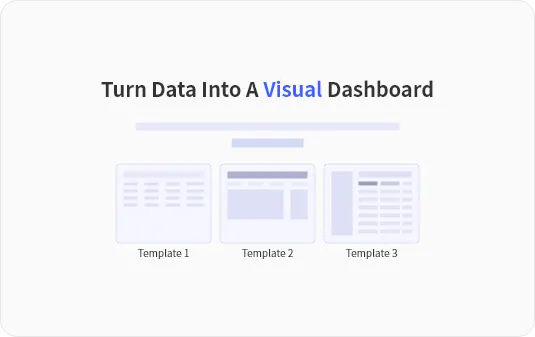
Converting Excel Models into Dynamic Dashboards
Static charts are limited. Dashboards are decision systems.
- Select key tables and KPIs
- Run Excel to Dashboard
- Get a secure, interactive executive dashboard instantly
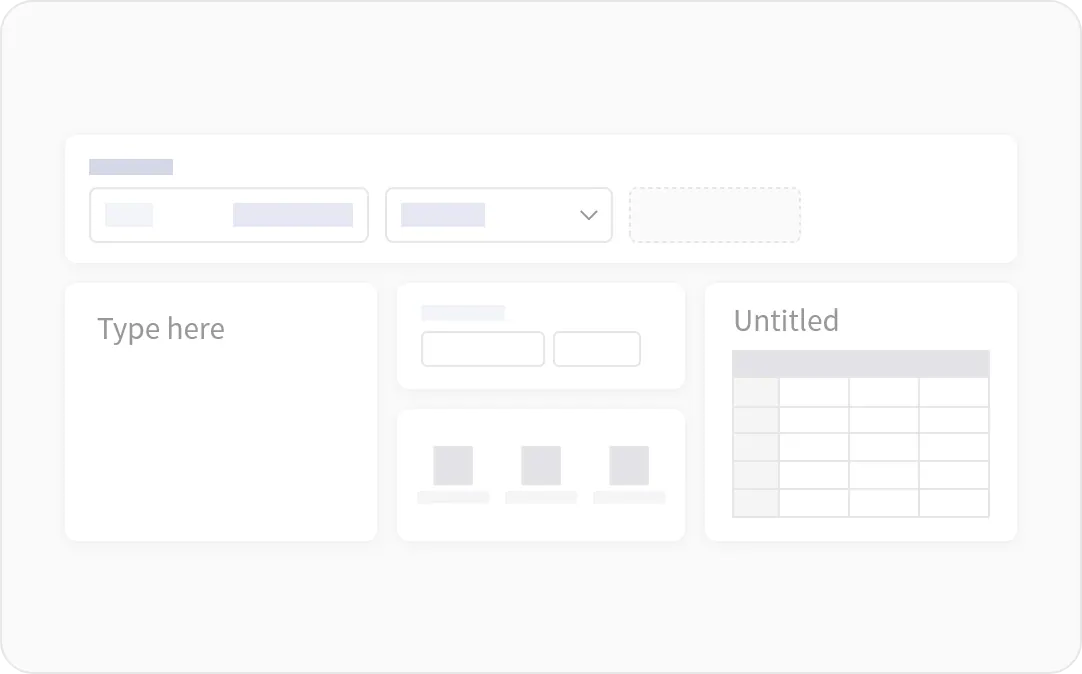
Interactive AI-Generated Dashboard
Upload your Excel file and generate an executive dashboard in seconds.
Generate My DashboardElevate Your Skills:
From Chart Maker to Financial Storyteller
RowSpeak AI doesn't replace analysts — it elevates them.

Financial Analysts
From manual formatting → instant root-cause explanations

FP&A Teams
From slow scenarios → real-time decision simulation

Accountants
From data prep → accurate KPI tracking and faster close
The focus shifts from computation to strategic communication.
Ready to See Your Data Differently?
Stop struggling with charts that fail to communicate risk or opportunity.
4x faster reporting Higher-quality risk & forecasting discussions Seamless Excel-native workflow Turn your next Excel file into an intelligent financial dashboard.