
AI Dashboard Generator for Excel and CSV Files
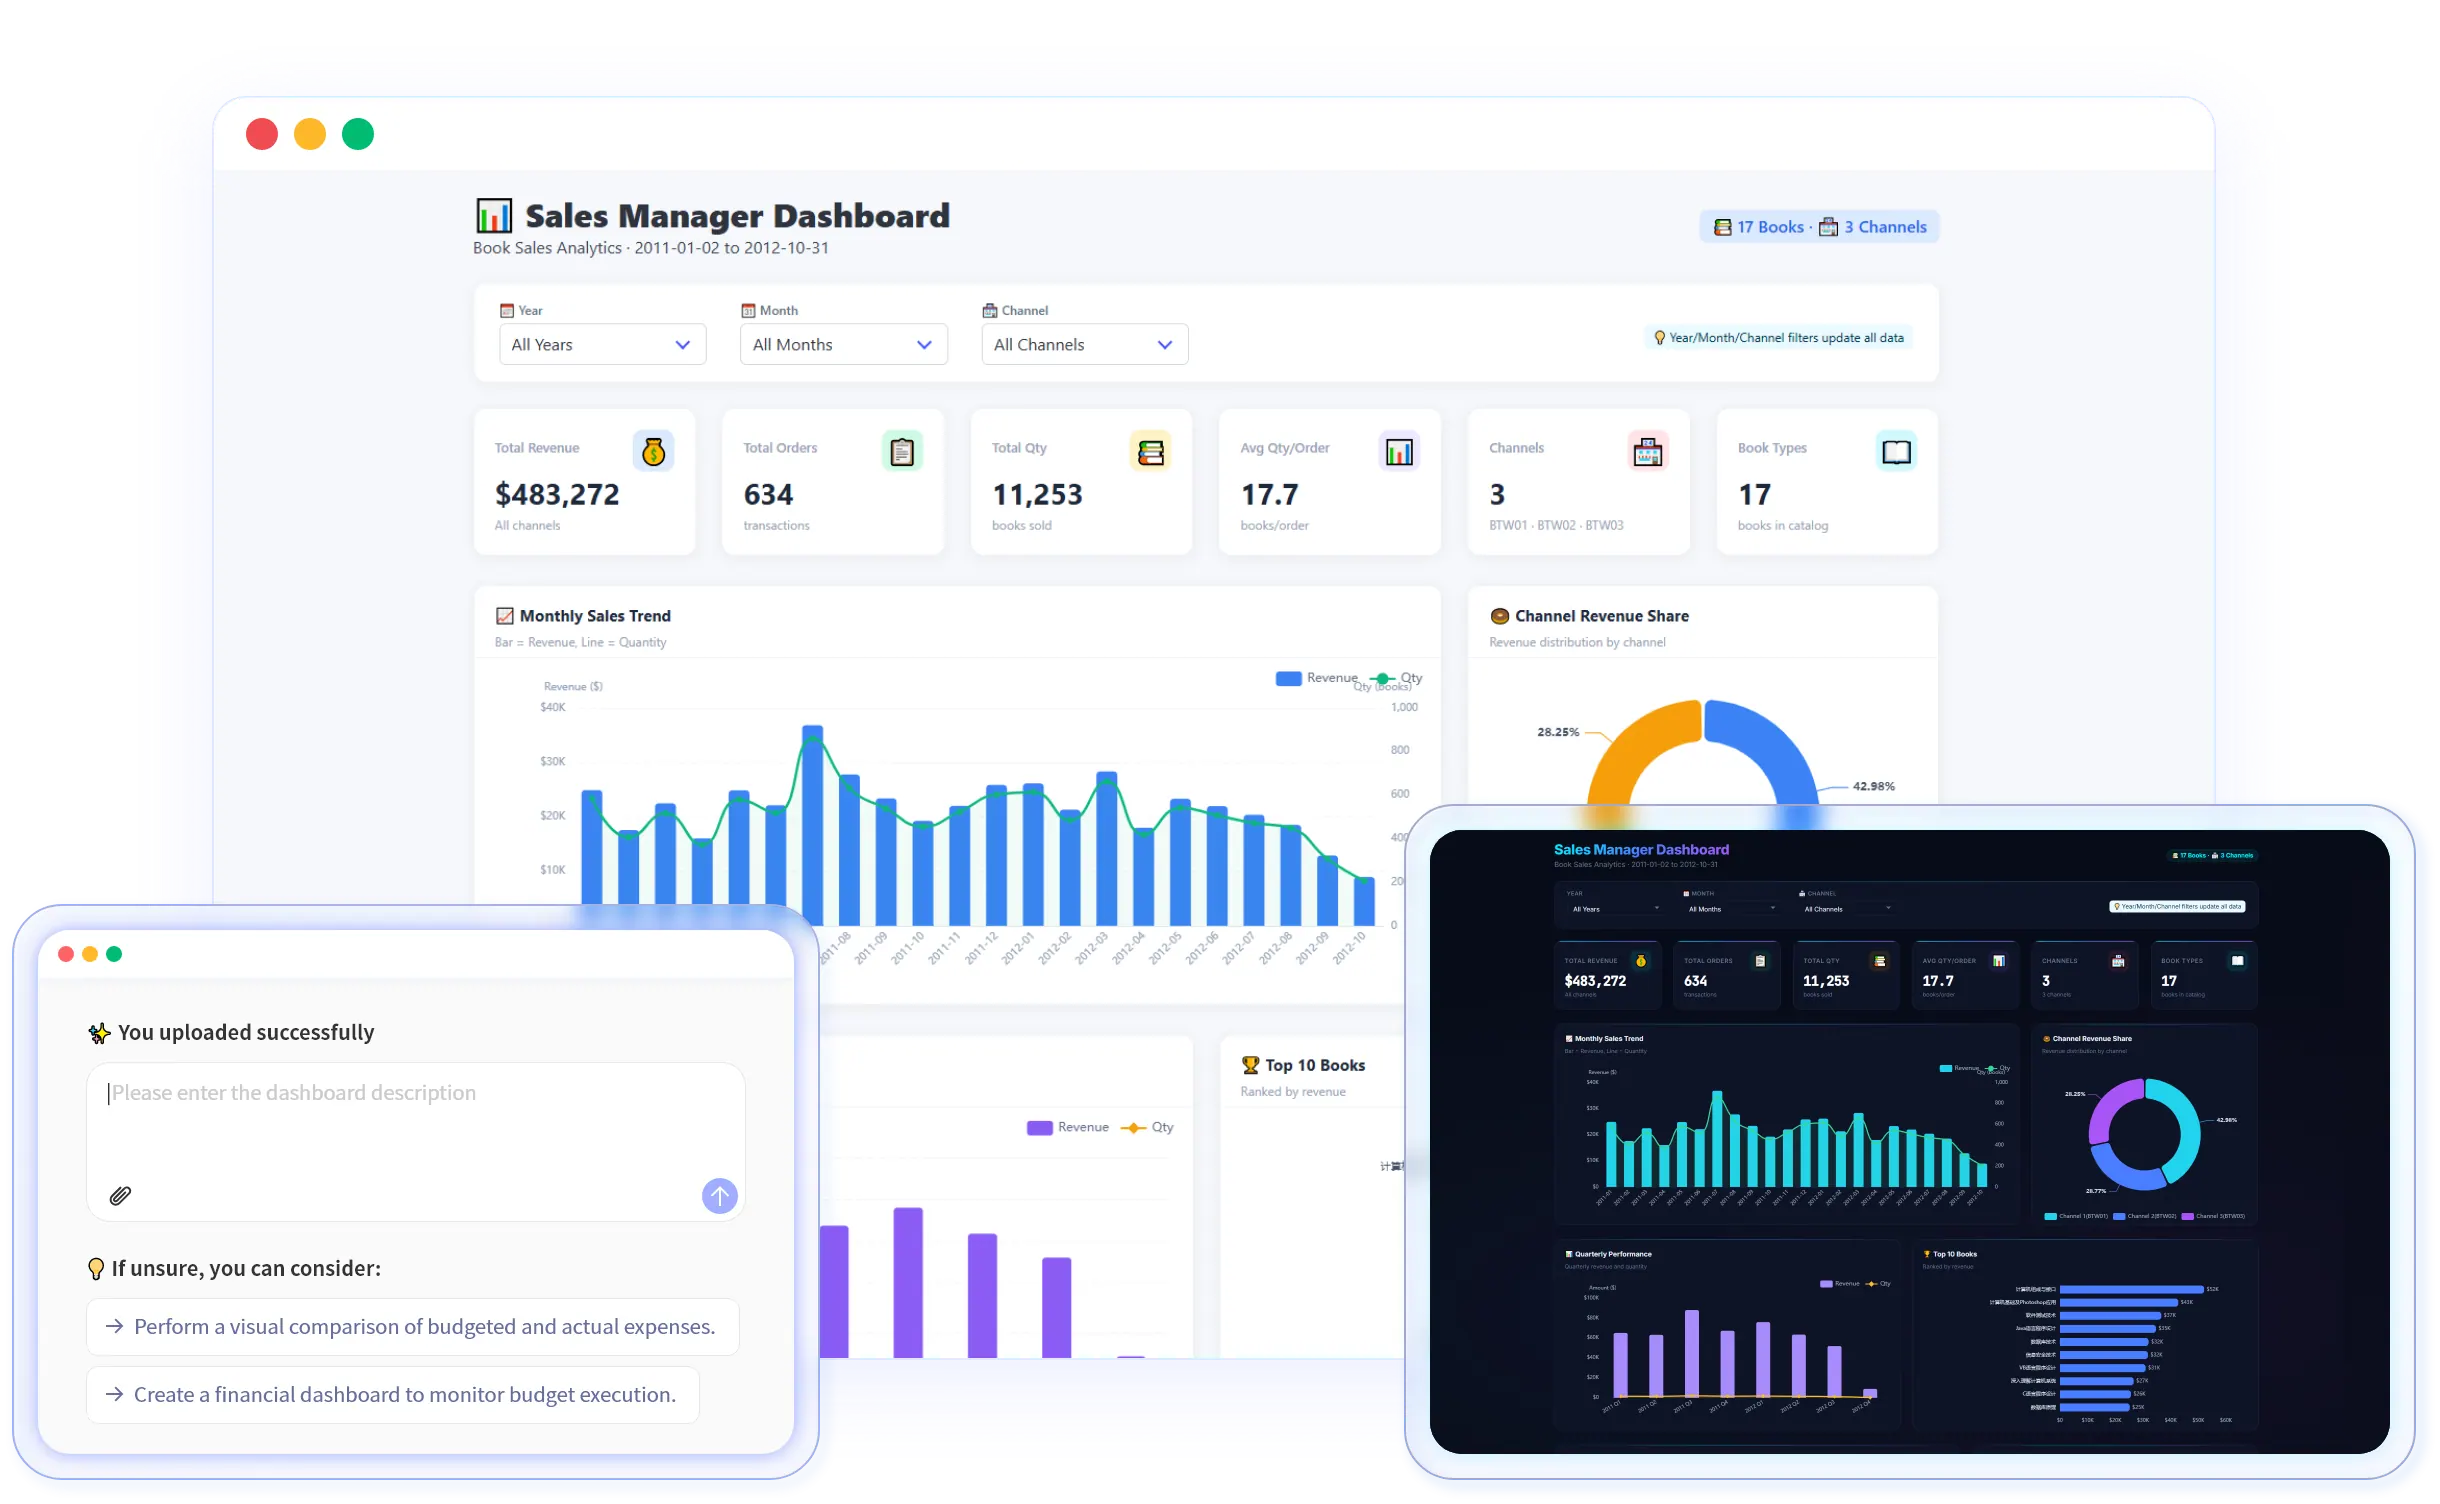
Excel and CSV files
Start from the workbook your team already has.
Dashboard layout
KPIs, charts, filters, rankings, summaries.
Browser-ready HTML
Open the finished dashboard directly in a browser.
Continue in chat
Adjust content before you share it.
Features
Unlock a new spreadsheet visualization experience
Say goodbye to data preparation
Upload sales, finance, inventory, marketing, or operations exports instead of rebuilding the dataset in a BI tool first.
Ask for the dashboard view
Multiple data modules, with conversational planning for your presentation layout.
Charts, KPI cards, and summaries
Generate visual dashboard blocks with supporting written insights so the numbers are easier to explain.

Review before you share
Check assumptions, adjust sections, filter data ranges, and refine the dashboard before it becomes a report or meeting asset.

Dashboard examples for business teams
Use sales, finance, inventory, project, marketing, and support examples as a starting point for your own Excel dashboard.

Fits between Excel and heavy BI
Use RowSpeak when you need dashboard clarity from spreadsheet exports without a full data warehouse or BI rollout.

How It Works
Simple Steps to Get Started
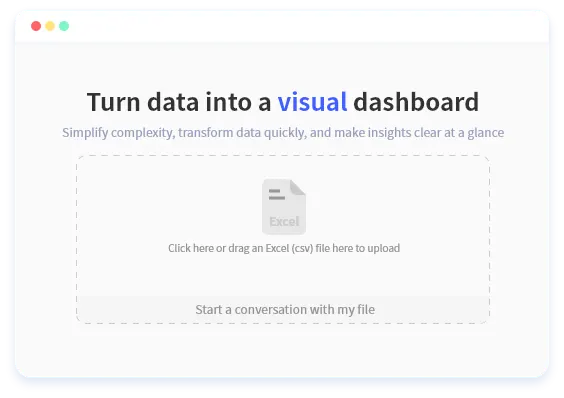
1. Upload the Excel or CSV file
Start from the spreadsheet export you already use: sales pipeline, monthly budget, inventory count, campaign report, or support queue.
2. Describe the dashboard goal
Ask for a sales dashboard, KPI dashboard, budget dashboard, or a custom view with specific metrics, filters, and comparisons.
3. Review, refine, and share
Inspect the generated charts, KPI cards, and summaries, then adjust the view before presenting or sharing the dashboard.
Why Choose Us
Reasons to Choose RowSpeak
Faster first draft
Move from spreadsheet export to dashboard draft without manually building Pivot Tables and chart layouts.
Business context
Ask for dashboards by outcome, such as revenue review, inventory health, or budget variance.
Editable workflow
Refine filters, sections, and summaries when the first draft needs a correction or a tighter view.
Clear next step
Use the dashboard as a report, meeting view, or starting point for deeper RowSpeak analysis.
Application scenarios with dashboard examples
Choose a scenario card to open the matching RowSpeak dashboard preview. Each card combines the use case, example output, and direct preview link in one place.
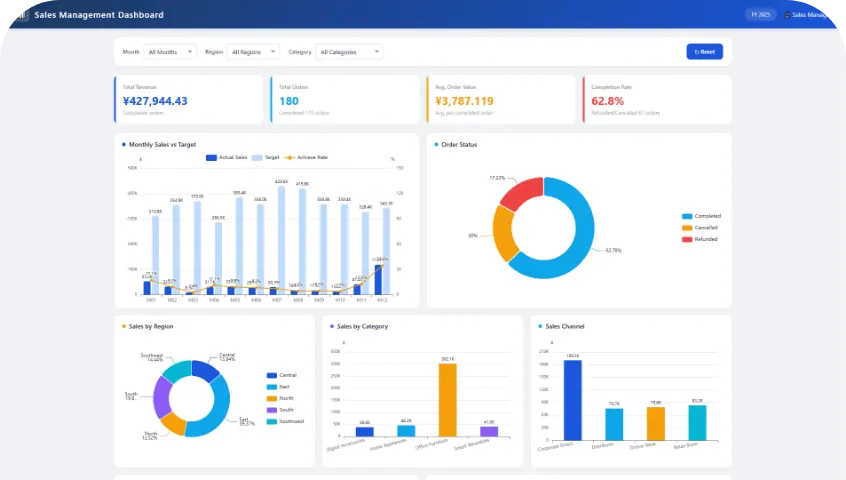
Sales performance dashboard
Turn pipeline, bookings, quota, and customer exports into a weekly revenue dashboard.
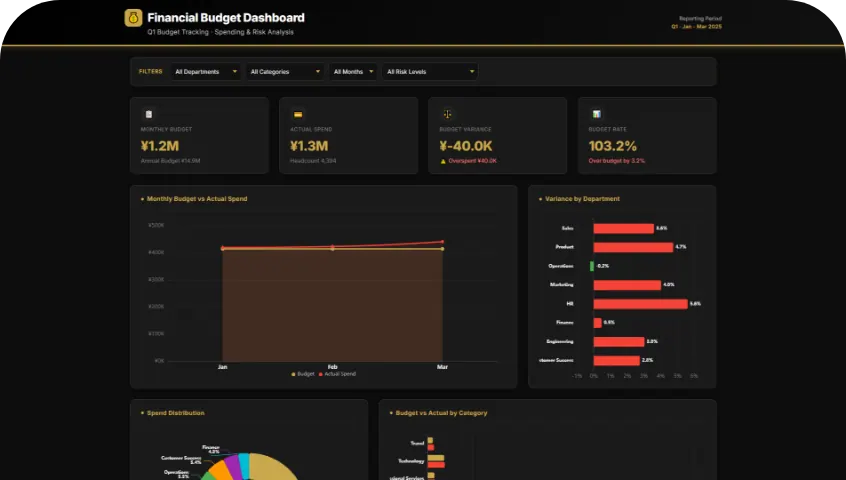
Finance operating dashboard
Summarize budget vs. actuals, expense categories, margin signals, and monthly movement.
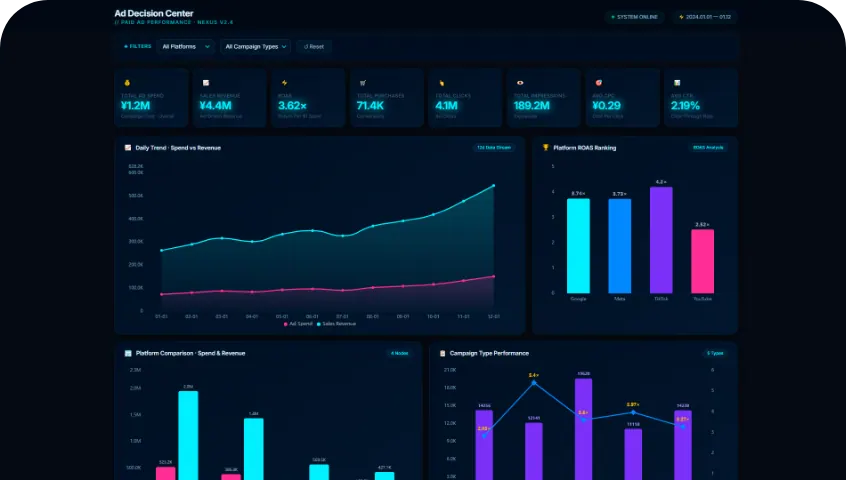
Campaign marketing dashboard
Compare channel spend, leads, conversion rates, campaign ROI, and growth quality.
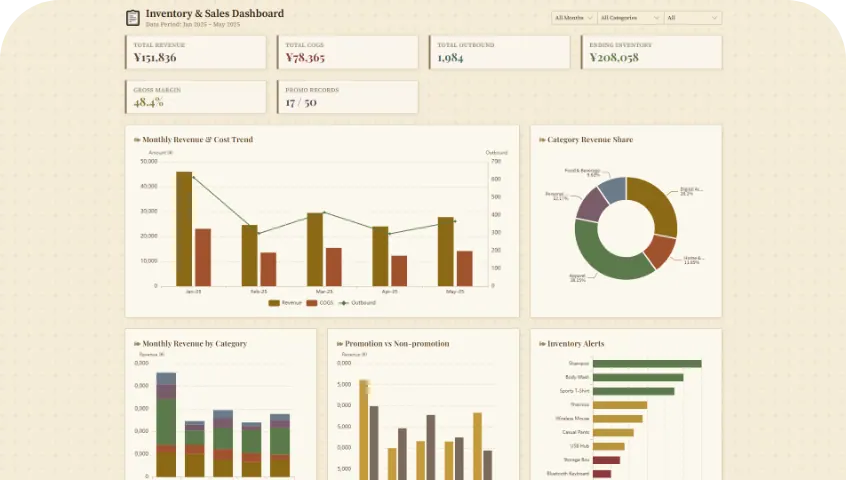
Inventory management dashboard
Track stock levels, aging inventory, SKU movement, reorder risk, and operating pressure.
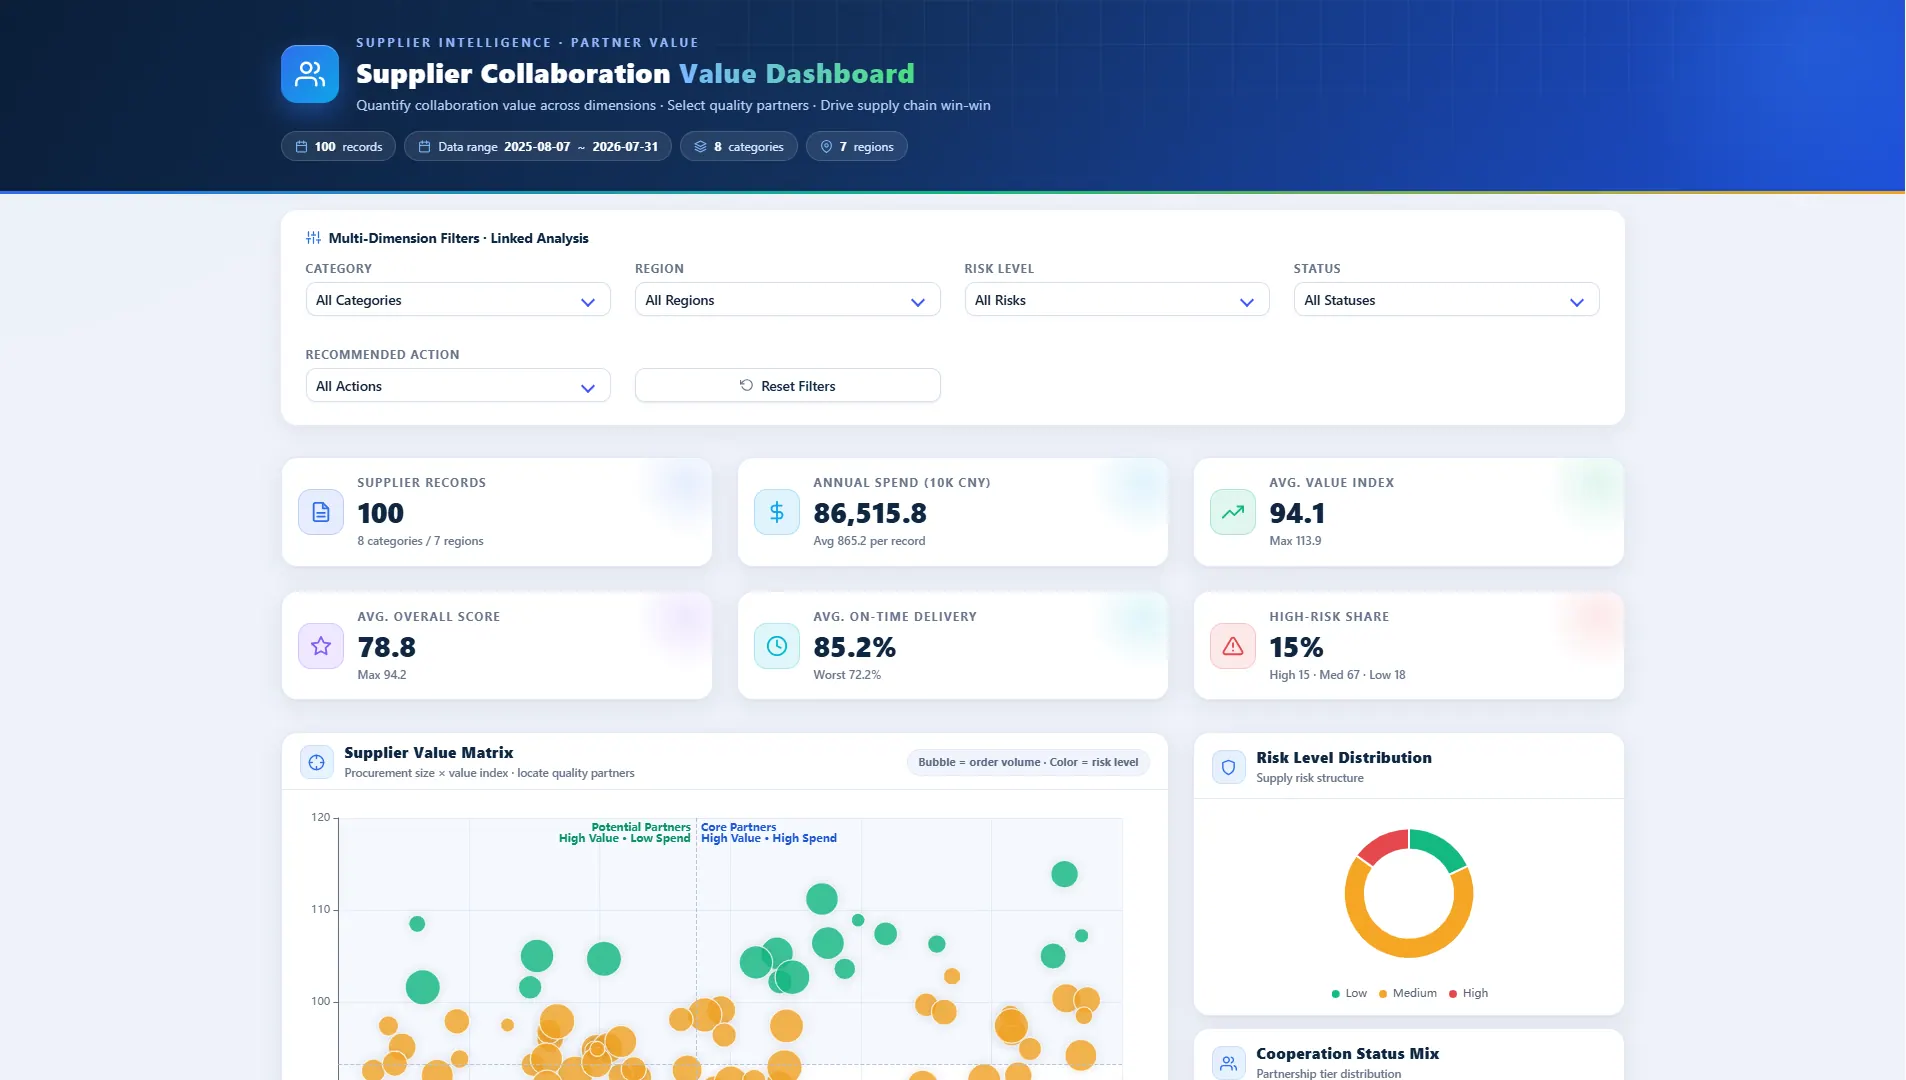
Supplier collaboration value dashboard
Compare supplier value, delivery performance, quality, and risk to identify stronger partners.
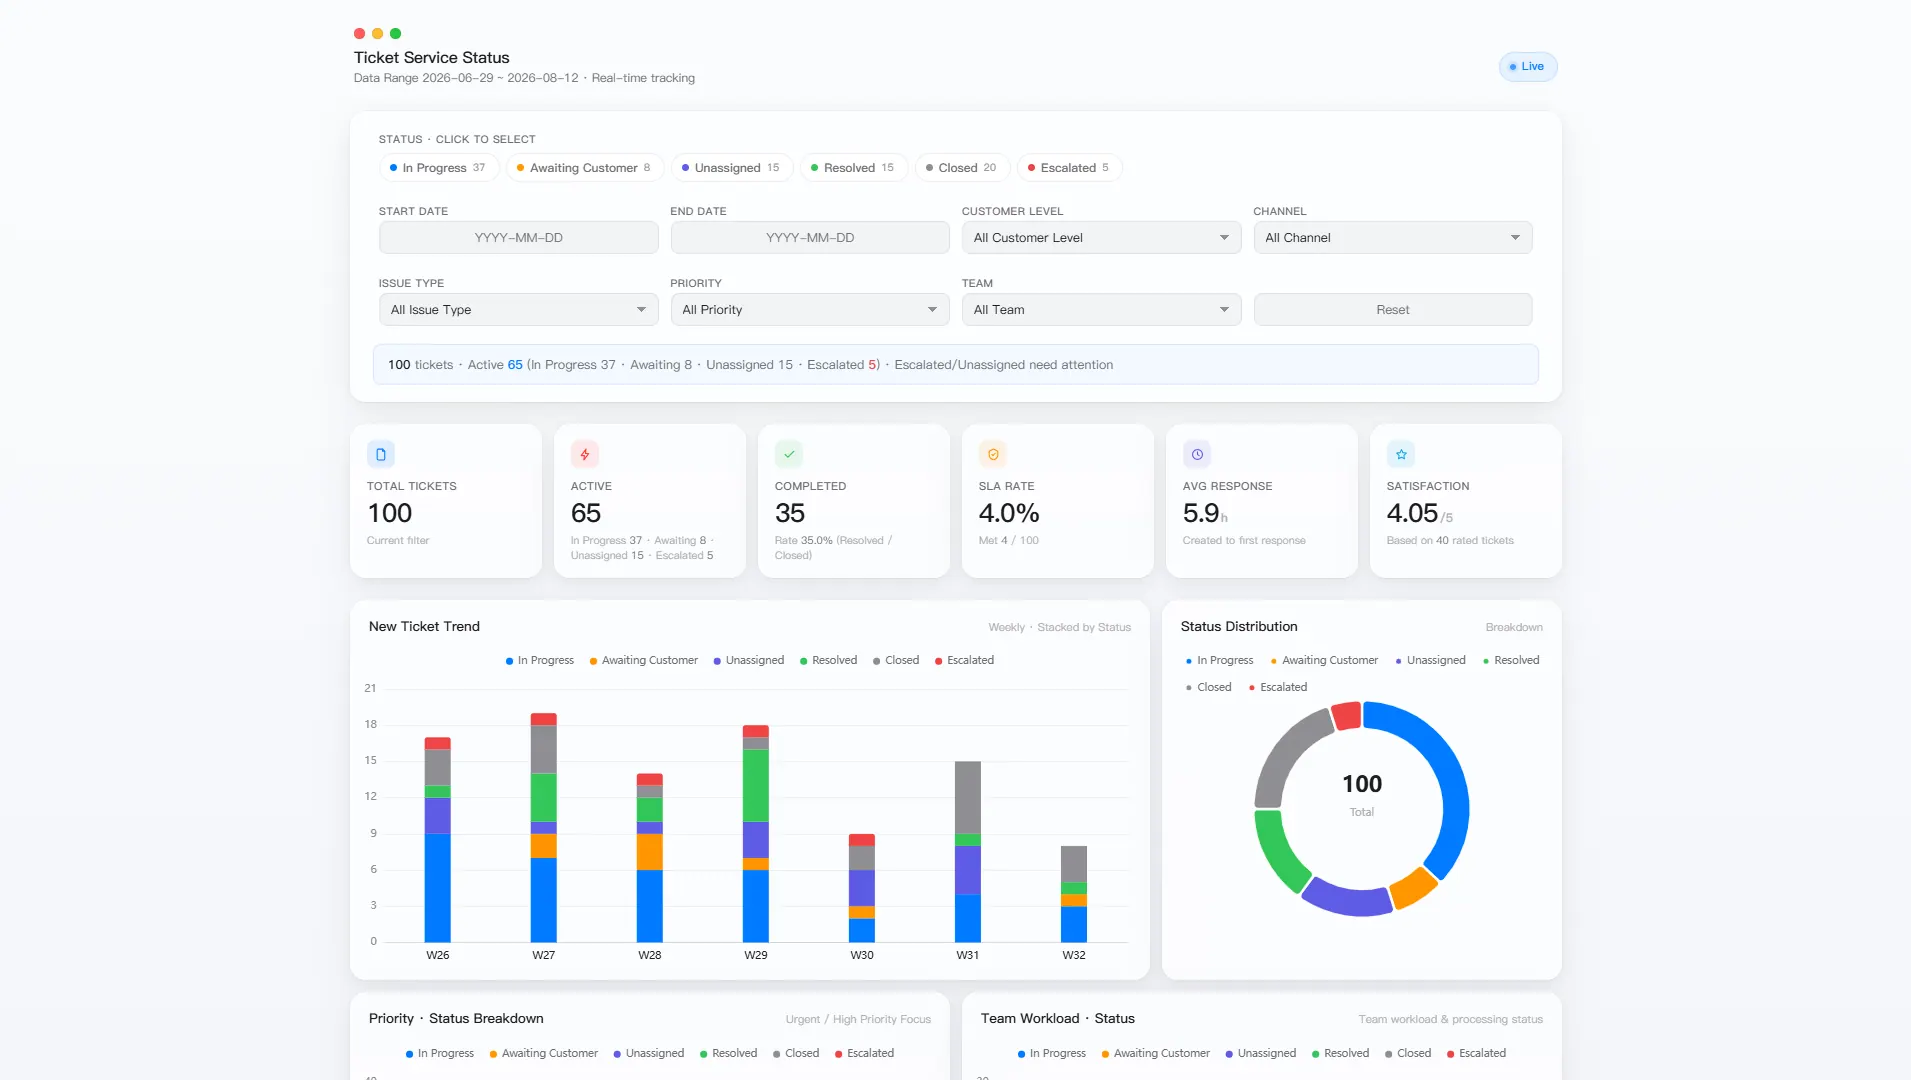
Ticket service status dashboard
Track ticket status, SLAs, response times, satisfaction, and team workload.
FAQs
How do I create a dashboard in Excel with AI?
Upload your Excel or CSV file to RowSpeak, describe the dashboard you need, then review the generated KPI cards, charts, filters, and summaries before sharing.
Can I build a dashboard from an Excel file online?
Yes. RowSpeak works in the browser, so you can upload a spreadsheet file and generate a dashboard without installing an Excel add-in.
Can I use dashboard templates?
You can start from common dashboard patterns such as sales, finance, inventory, marketing, project, and support views, then adjust the output for your file.
When should I use RowSpeak instead of Power BI or Tableau?
Use RowSpeak when your source is a spreadsheet export and you need a fast, reviewable dashboard or report. Use a BI platform when you need governed, always-on dashboards across many connected systems.
Create a dashboard from your Excel file
Upload a spreadsheet, ask for the view you need, and review the generated dashboard before you share it.
Start free trial