Comprehensive Financial Statements and Ratio Analysis Template
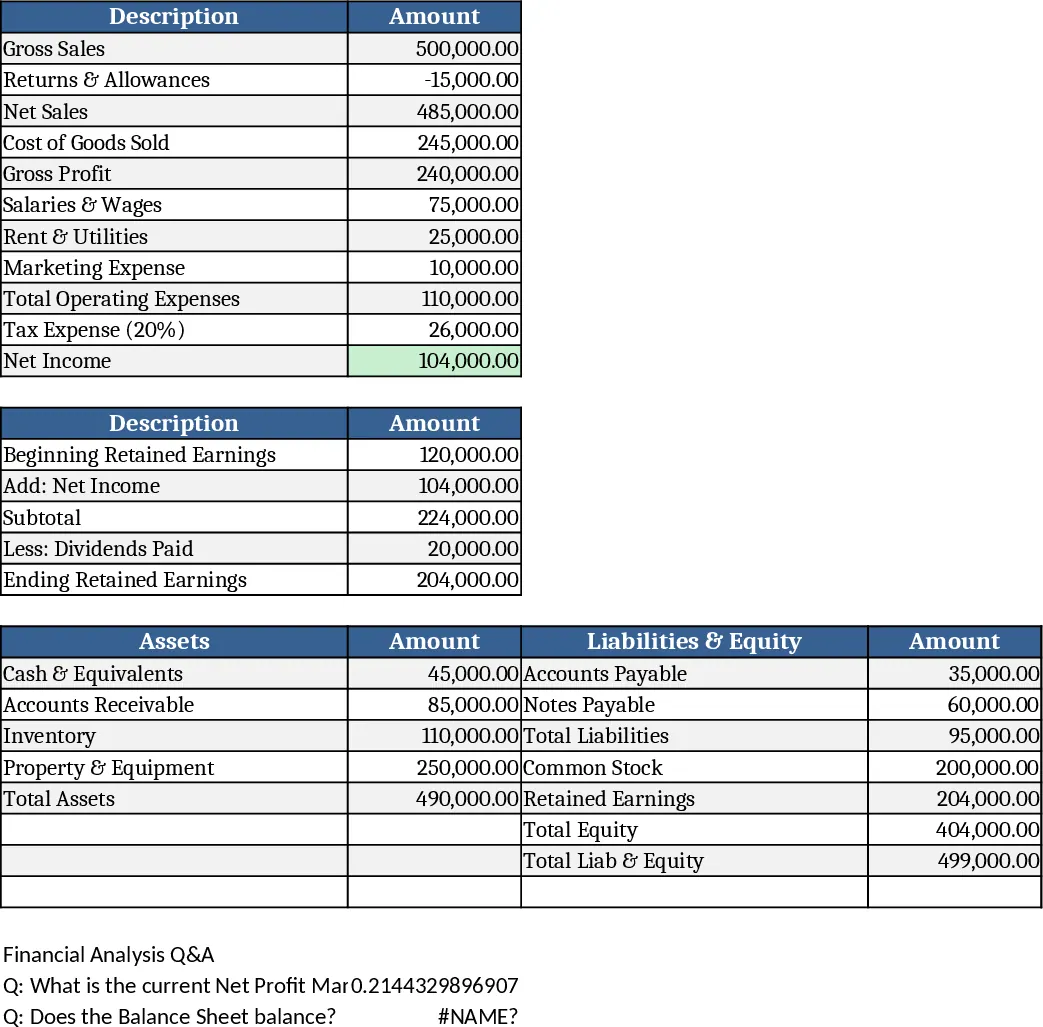
This Excel template bundles the core financial statements—Income Statement, Statement of Retained Earnings, Balance Sheet, and Cash Flow Statement—for three sample companies, plus a set of common financial ratios. Each company has its own worksheet, clearly labeled (e.g., "ABC Corp", "Kyler Media", "Victor's Natural Foods"). Within each sheet you’ll find pre‑filled tables for revenues, expenses, assets, liabilities, equity, and cash‑flow line items. The ratio sheet contains formulas that automatically calculate current ratio, acid‑test ratio, inventory turnover, days in inventory, days sales outstanding, and gross profit percentage based on the numbers entered in the other sheets. A summary dashboard pulls the key results together, showing profit or loss, total assets, total liabilities, and owner’s equity at a glance.
The template is ideal for accounting students, finance interns, or anyone preparing for a financial‑statement exam. It solves the tedious task of manually linking data across multiple statements and eliminates calculation errors, letting users focus on interpreting results rather than re‑entering numbers. By having all statements in one file, users can instantly compare how changes in revenue or expenses flow through to cash and equity, reinforcing the cause‑and‑effect relationship taught in introductory finance courses.
With this workbook you can track a company’s profitability, liquidity, and efficiency in a single place. The built‑in ratio calculations highlight strengths and weaknesses—such as whether current assets comfortably cover short‑term obligations or how quickly inventory turns into sales—providing a quick health check for each business scenario presented.
How to use
- Open the workbook and navigate to the company sheet you want to explore. Review the pre‑populated numbers or replace them with your own data; all linked cells will update automatically.
- Check the Income Statement tab to see revenue, expense breakdowns, and net income. The Statement of Retained Earnings will show how profit flows into equity after dividends.
- Switch to the Balance Sheet tab to verify that assets equal liabilities plus equity; any discrepancy will be highlighted by the built‑in validation.
- Open the Cash Flow tab to see operating, investing, and financing cash movements, then glance at the Ratio sheet for automatically calculated financial metrics.
Expected benefits include faster preparation of exam answers, reduced manual calculation time, and clearer insight into how each financial statement interrelates, helping users study more efficiently and confidently.
Similar Templates Recommendation
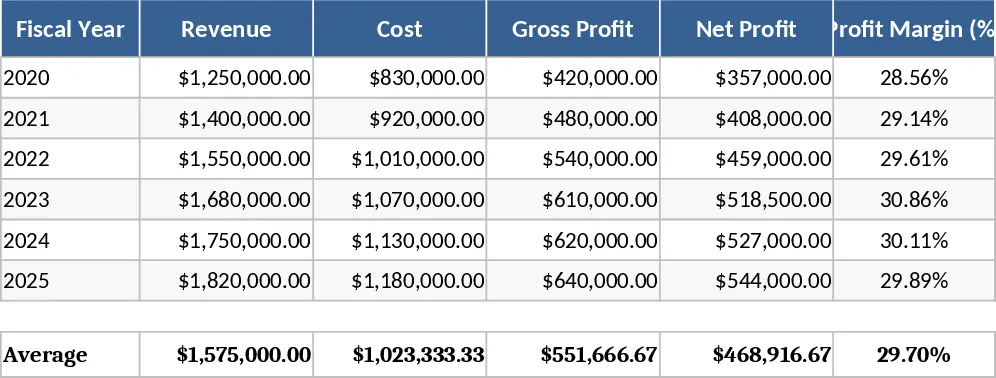
Financial Analysis with Dashboard Template
Monitor business performance with integrated income statements, balance sheets, and automated financial ratios to drive smarter growth strategies.
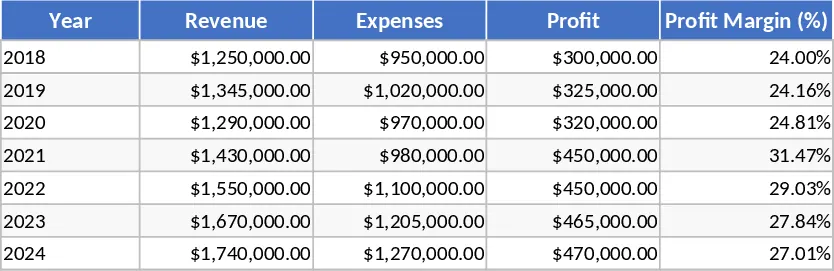
Financial Analysis with Budget Plan Template
Track income, expenses, and key performance ratios to evaluate business health and make data-driven decisions with this comprehensive financial analysis tool.
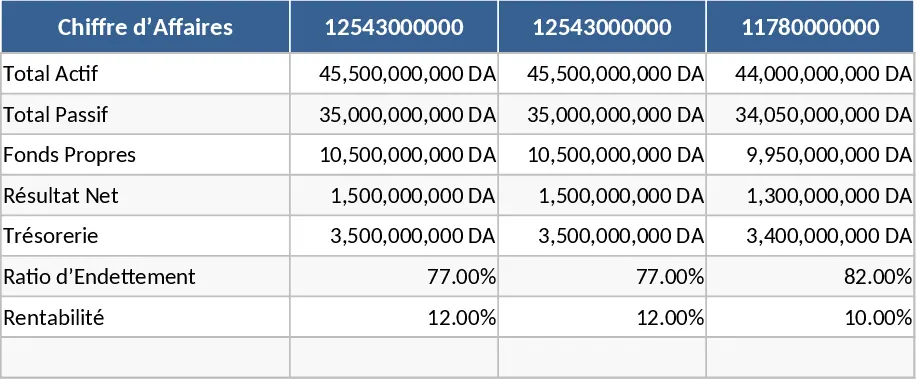
Algerian SCF Financial Analysis Template
Conduct in-depth financial analysis and generate compliant reports based on the Algerian National Accounting System (SCF) standards.