Restaurant Daily Sales & Profit Dashboard Template
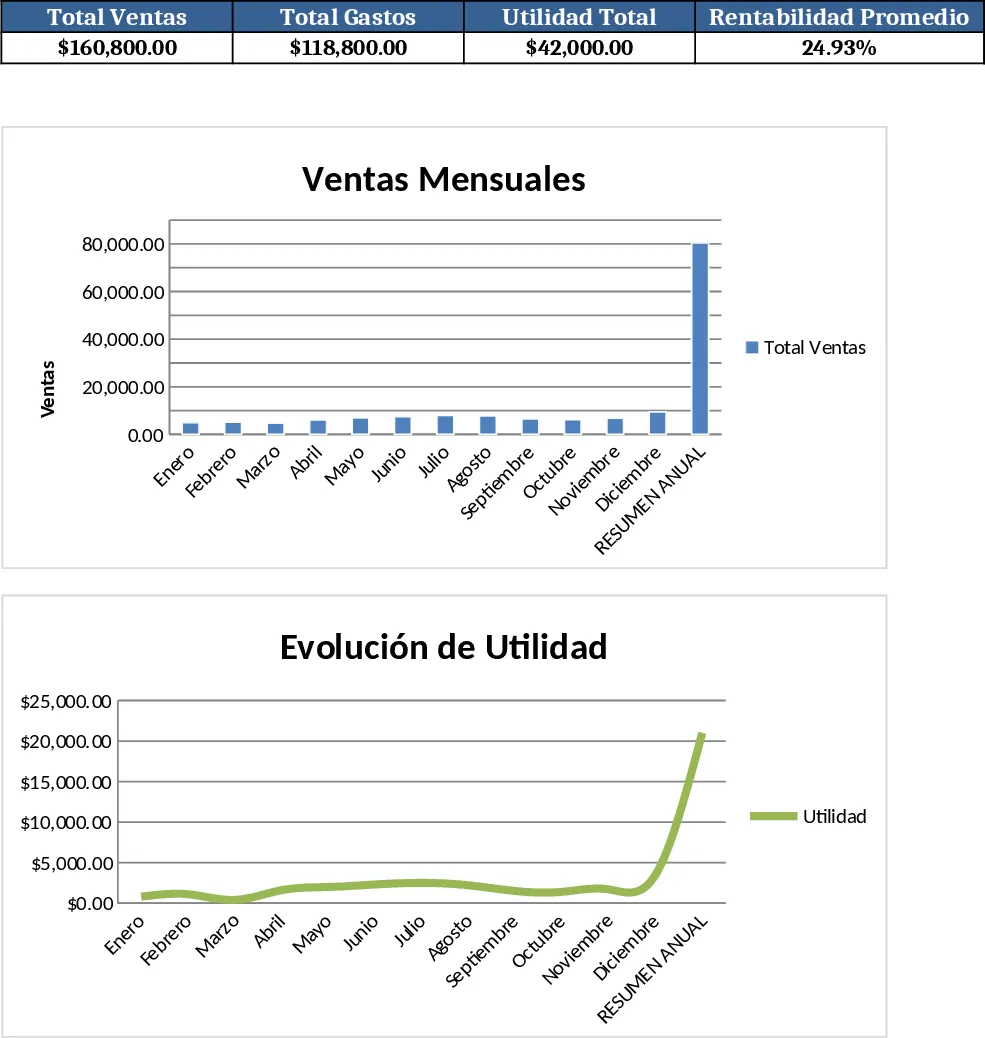
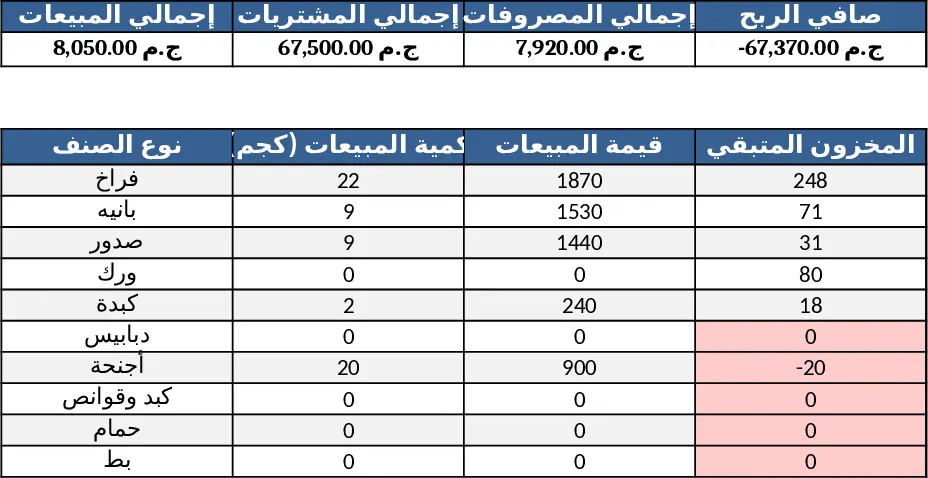
This Excel template is built for restaurants that need a clear, automated view of their daily product sales, recurring expenses, and overall profitability. It contains four main sheets: Sales Data, where you log each transaction with fields for date, product (chosen from a dropdown), quantity, unit price and automatically calculated line total; Expenses, where daily costs are recorded by supplier, category and amount; Settings, where you define your product list, price list, expense categories and supplier names – these drive the dropdowns in the other sheets; and Dashboard, a visual summary that pulls data from the two log sheets to show daily totals, monthly sales by product, expense breakdowns, gross profit, net profit and profit margin, all displayed in tables and charts. Optional VBA macros can refresh the dashboard with a single click, ensuring the latest numbers are always shown.
The template eliminates the tedious manual calculations that typically slow down restaurant owners and managers. By centralising sales and cost data, it provides instant insight into which menu items drive revenue, where costs are rising, and how each month’s profitability compares to targets. The built‑in charts make it easy to spot trends, such as seasonal dips in sales or spikes in supplier costs, allowing you to act quickly on the information. This saves time, reduces errors, and supports data‑driven decisions for menu pricing, staffing, and supplier negotiations.
Designed for restaurant owners, general managers, and accountants, the file works for any dining operation that sells multiple products and incurs daily operational expenses. Whether you run a single‑location café or a multi‑outlet bistro, the template adapts to your menu and expense structure. It is especially useful during month‑end close, when you need to produce a concise profitability report for stakeholders or to compare performance across periods.
How to use
- Open the Settings sheet and enter your product names, unit prices, and supplier list – these will populate dropdowns in the data entry sheets.
- Each day, record every sale in the Sales Data sheet, selecting the product from the dropdown and entering quantity; the total sales amount calculates automatically.
- Log all daily expenses in the Expenses sheet, choosing the appropriate supplier and expense category.
- Press the optional macro button or simply refresh the Dashboard sheet to see updated totals, charts, and profitability metrics.
Expected benefits: faster month‑end reporting, fewer manual errors, and a quick visual snapshot of how your restaurant is performing financially, helping you allocate resources more efficiently.