Production Maintenance and Quality KPI Dashboard Template
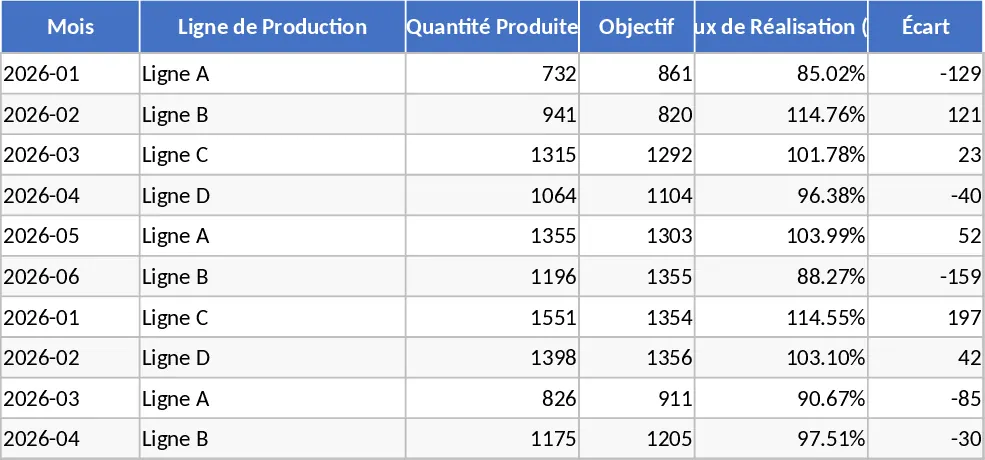
The Production, Maintenance, and Quality KPI Dashboard is an advanced analytical tool designed to bring clarity and precision to complex manufacturing environments. In modern industrial settings, data is often scattered across different departments, making it difficult to see the big picture. This template bridges those gaps by providing a unified framework where production output, equipment reliability, and quality standards are tracked side-by-side. The structure includes dedicated modules for daily production logging, maintenance scheduling, downtime tracking, and quality assurance metrics. Each section is equipped with intuitive dropdown menus and standardized fields to ensure data consistency across your entire team, while the summary outputs provide high-level views of Overall Equipment Effectiveness (OEE), availability, and performance.
This dashboard is particularly useful for operations managers, quality engineers, and maintenance supervisors who need to monitor real-time performance against set targets. It solves the persistent problem of operational silos, where the maintenance team might not realize how their scheduling affects production quotas, or where production teams might overlook quality trends in the rush to meet deadlines. By visualizing these metrics together, you can easily identify if a spike in defects is linked to a specific machine lack of maintenance or if production delays are stemming from recurring minor stops. The template helps you maintain a pulse on your operational health and is designed for use during daily shift handovers, weekly performance reviews, and monthly strategic planning sessions.
By having a single source of truth, you can foster better communication between departments and ensure everyone is working toward the same efficiency goals. The visual nature of the dashboard makes it easy to present findings to stakeholders, highlighting successes and pinpointing areas that require immediate intervention or capital investment. It transforms raw data into actionable insights, allowing you to move from reactive firefighting to proactive optimization, ensuring that production targets are met without compromising on safety or quality standards.
How to use this template:
- Define your operational parameters by entering your production targets, machine lists, and shift schedules into the configuration sheet to tailor the dashboard to your specific environment.
- Log daily activities by inputting your actual production counts, recorded downtime events including reasons for the stop, and quality inspection data into the respective tracking sheets.
- Analyze the results on the main dashboard to view automatically updated charts, gauges, and trend lines that highlight your OEE and other critical performance indicators.
- Generate reports using filtered views to drill down into specific dates, machines, or product lines to identify bottlenecks and prepare for management reviews.
By implementing this structured approach to data management, you can expect a significant reduction in the time spent on manual report generation and data consolidation. This template empowers your team to make data-driven decisions faster, leading to improved equipment uptime, higher product quality, and a more streamlined production process overall.
Similar Templates Recommendation
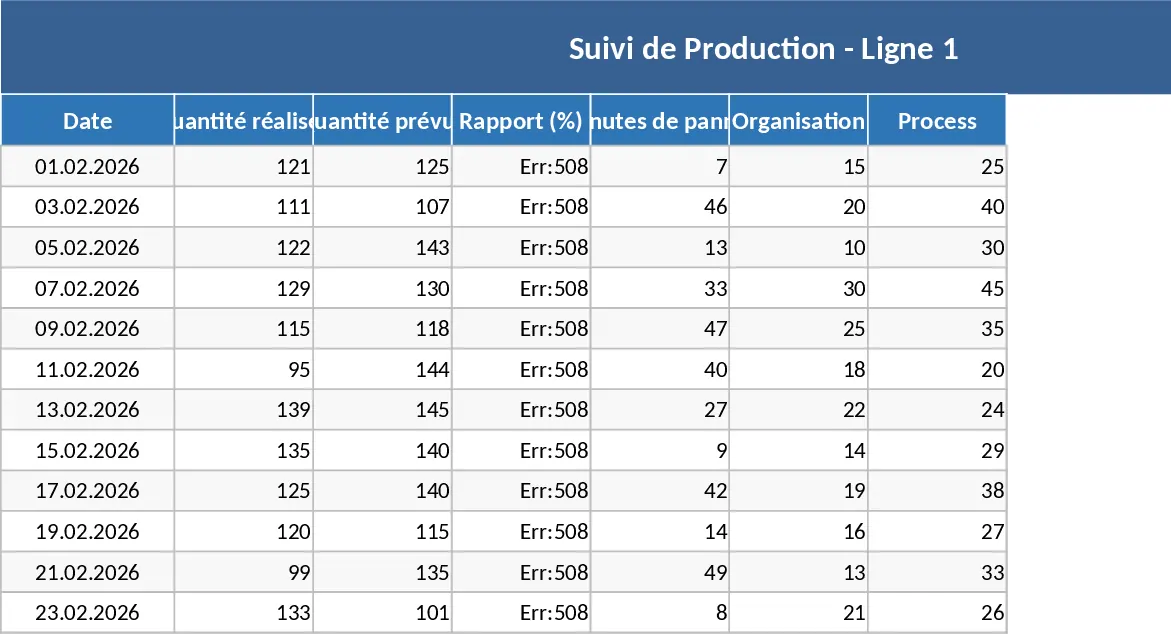
Daily Multi-Line Production and Downtime Tracking Template
Monitor daily production output, efficiency, and downtime across multiple lines using automated pivot tables and interactive performance dashboards.
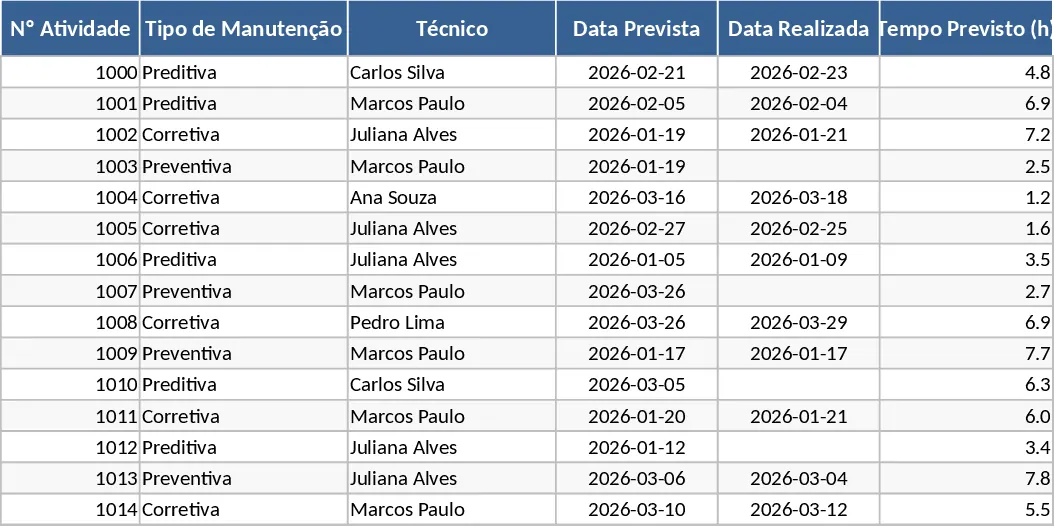
Maintenance Management and Performance Dashboard Template
Track planned vs. executed maintenance tasks, monitor technician performance, and visualize corrective or preventive trends with a dynamic dashboard.
CNC Lathe Performance and KPI Tracking Template
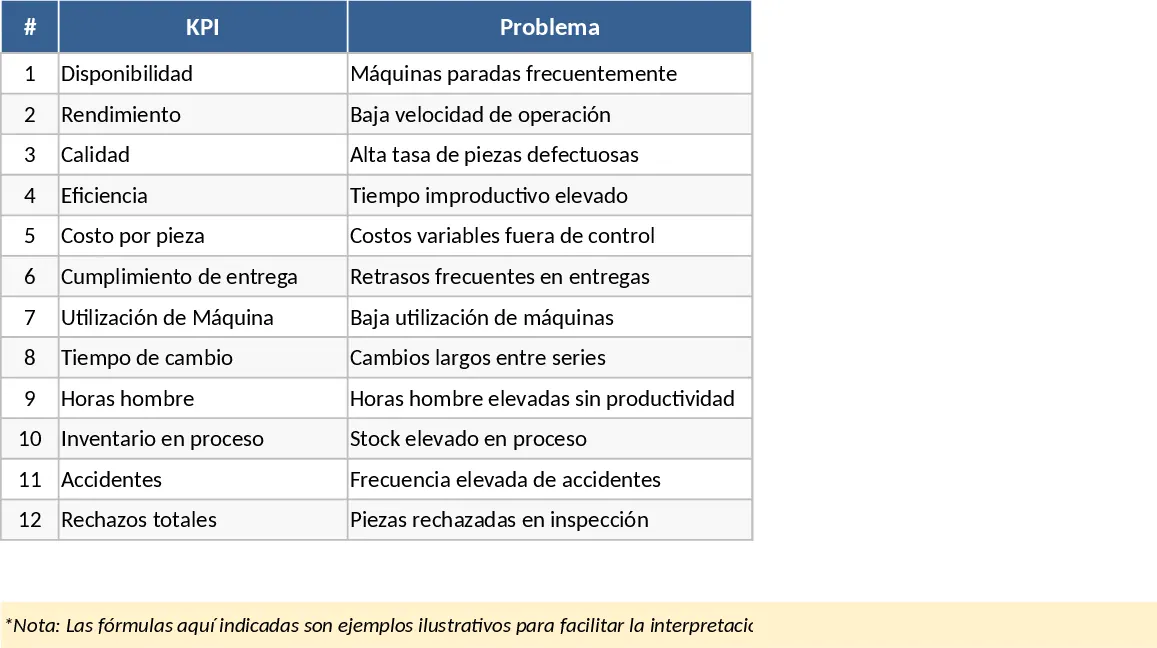
Monitor CNC lathe performance with 12 specialized KPIs to track scrap rates, machine availability, operator efficiency, and tool usage.