Daily Multi-Line Production and Downtime Tracking Template
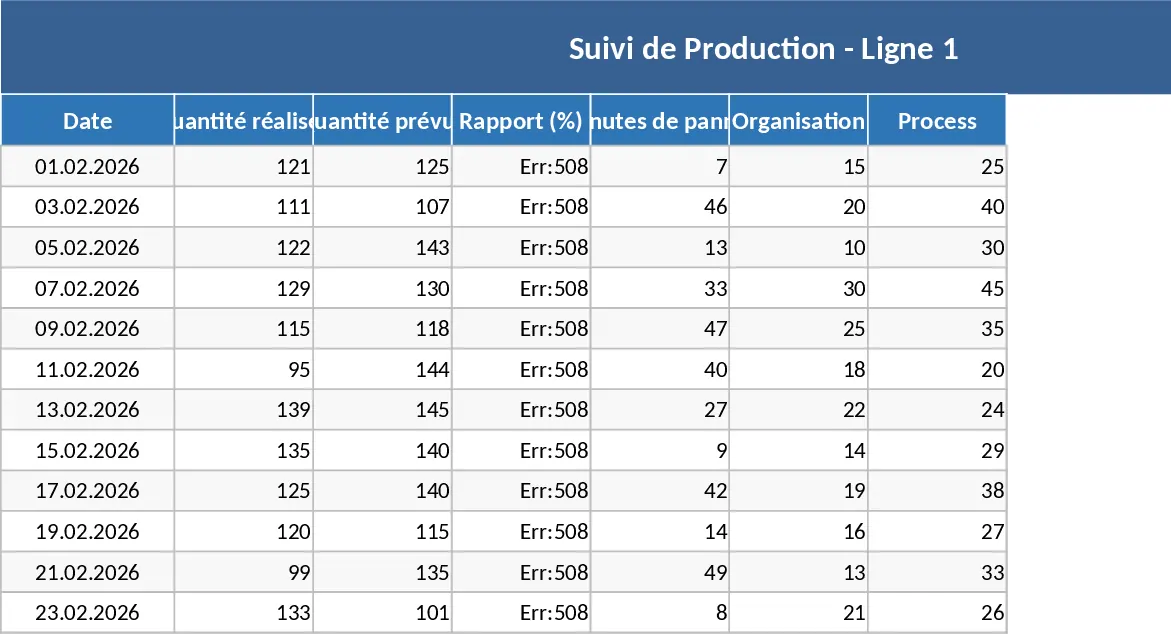
This Production Tracking Excel template provides a robust framework for manufacturing environments that require precise daily monitoring of multiple production lines. The template is structured around a central Data Entry sheet where users log essential metrics including the date, planned production quantities, and actual pieces realized. To ensure a deep dive into operational hurdles, the sheet includes specific columns for downtime tracking, categorized into mechanical breakdowns, organizational issues, and process-related delays. This granular approach ensures that every minute of lost time is accounted for, providing a clear picture of the gap between planned and actual output. The template also features automated color-coding for efficiency percentages, making it easy to spot underperforming days at a glance.
Managing three different production lines simultaneously can often lead to data silos and reporting delays. This template solves that problem by consolidating all line data into a single, scalable system. It automatically calculates the efficiency ratio—the percentage of actual production versus planned targets—saving you from repetitive manual math. For production managers, this means moving away from messy paper logs or basic spreadsheets toward a professional, automated system that highlights performance trends and identifies recurring bottlenecks. Whether you are dealing with equipment wear and tear or workflow inefficiencies, the template helps you visualize the root causes of production dips and facilitates better communication between shifts by providing a clear history of what happened on the floor.
Designed for shift supervisors, plant managers, and operational excellence teams, this tool is ideal for daily huddles and weekly performance reviews. In a fast-paced factory setting, having a single source of truth allows teams to discuss data rather than debating the accuracy of the numbers. It is particularly effective in scenarios where production targets are tight and downtime needs to be minimized to maintain profitability. By tracking downtime in minutes across different categories, the template empowers maintenance and operations teams to collaborate on targeted improvements based on real evidence rather than intuition.
The power of this template lies in its dynamic reporting capabilities. It utilizes advanced Pivot Tables that grow with your data, ensuring that your summaries are always up to date. The dashboard includes individual graphical representations for each of the three production lines, allowing you to monitor productivity and downtime categories in isolation. Furthermore, a consolidated Master Chart aggregates data from all lines, providing a high-level overview of the entire facility's health. This dual-view approach ensures you never lose sight of the details while maintaining a strategic perspective on total output across the organization.
How to use: First, set up your production lines and input your daily targets and actual output in the Data Entry sheet, making sure to record any downtime in the designated columns for breakdowns, organization, or process. Second, navigate to the Analysis tab and right-click any pivot table to select Refresh, which will automatically pull in your latest entries and update all calculations and percentages. Third, use the interactive dashboard to select specific metrics or lines you wish to examine; the charts will update instantly to show productivity trends and downtime distributions. Finally, review the consolidated chart to compare performance across all lines and identify which areas require immediate attention or resource reallocation.
Expected benefits: Enhanced data accuracy and hours saved on manual report generation each week.
Similar Templates Recommendation
Production Maintenance and Quality KPI Dashboard Template
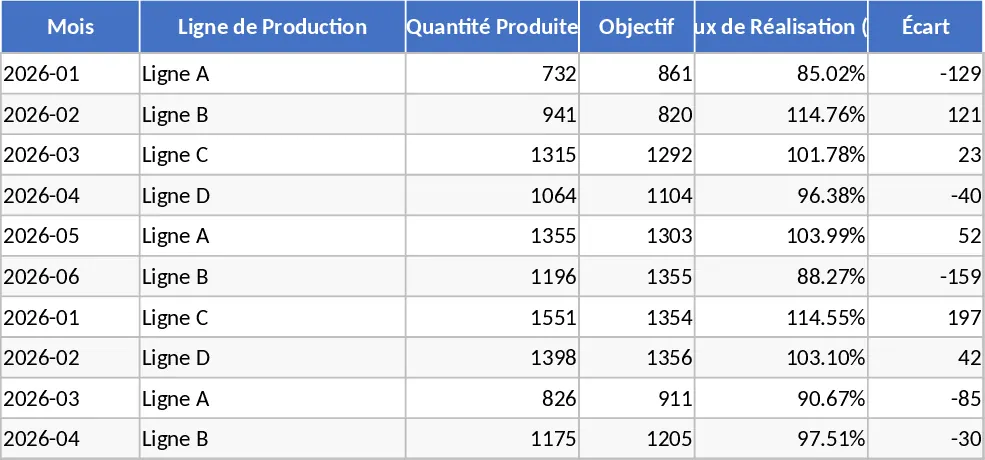
Monitor manufacturing performance, equipment reliability, and quality standards through a comprehensive visual dashboard of key performance indicators.
Production Performance and Individual Progress Dashboard Template
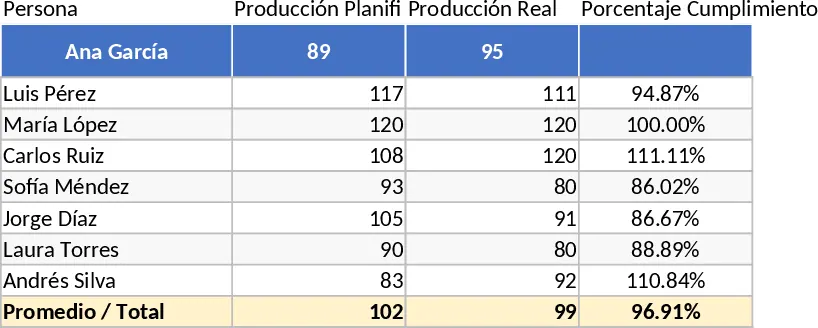
Track daily production percentages and individual performance metrics to optimize operational efficiency and monitor output targets in real-time.