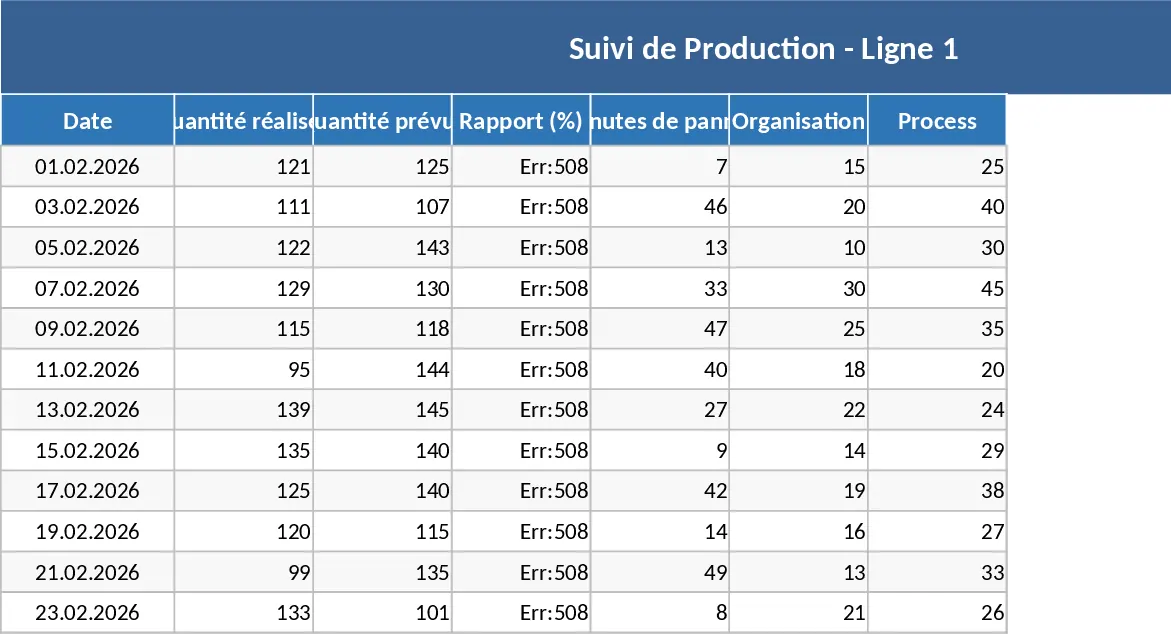
Production Performance and Individual Progress Dashboard Template
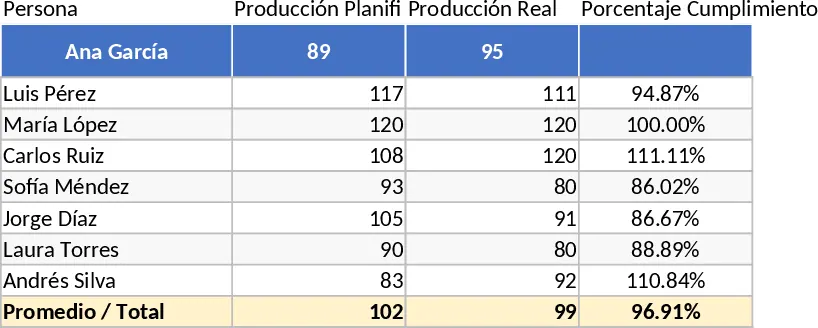
This professional production and daily tracking template is designed to bridge the gap between raw operational data and high-level strategic insights. The template features a multi-sheet structure starting with a comprehensive data entry log where you can record granular details such as date, shift, employee names, specific tasks, and units produced. It also includes dedicated sections for setting production benchmarks and individual targets, which serve as the baseline for all performance calculations. The core of the template is the visual dashboard, which utilizes advanced charting to display production percentages, trend lines, and comparative rankings of team members.
In a fast-paced production environment, staying on top of daily quotas is essential for maintaining profitability and meeting client deadlines. This template solves the common problem of data silos where production logs are scattered across different notebooks or basic spreadsheets. By centralizing this information, you gain a holistic view of your operations, making it easier to spot inefficiencies or equipment downtime that might be hindering your output. The benefit to your daily workflow is immediate: instead of spending hours compiling reports at the end of the week, you have a live document that reflects the current state of your production floor with minimal effort.
This tool is an ideal solution for operations managers, production supervisors, and team leads who oversee manufacturing processes or assembly lines. It is particularly effective in scenarios where individual accountability is key, as it allows for a transparent view of how each person contributes to the overall goal. By tracking performance day-to-day, you can provide timely feedback to your staff, recognize top performers, and implement corrective actions where necessary. It helps you manage not just the volume of work, but the quality and consistency of your team's output over time.
The template helps you track key performance indicators (KPIs) such as target achievement rates, individual efficiency scores, and daily output fluctuations. This level of detail is crucial for identifying seasonal trends or specific days of the week where production might dip. Having this data organized and visualized makes it much easier to present findings to stakeholders or upper management, providing a professional report that highlights both successes and areas for improvement.
How to use:
- Begin by customizing the configuration sheet with your specific team names, production units, and the daily targets you wish to achieve for the period.
- On a daily basis, input the actual production figures into the tracking sheet, making sure to select the correct employee and date from the dropdown menus to maintain data integrity.
- Navigate to the Dashboard sheet to view the automatically generated charts; use the built-in filters to drill down into specific dates or individual performance metrics.
- Review the summary reports to identify any gaps between actual production and your targets, then use these insights to adjust your operational strategy for the following day.
Expected benefits: You can expect a significant reduction in administrative overhead and a clearer understanding of team productivity, leading to more informed scheduling and resource management.
Similar Templates Recommendation
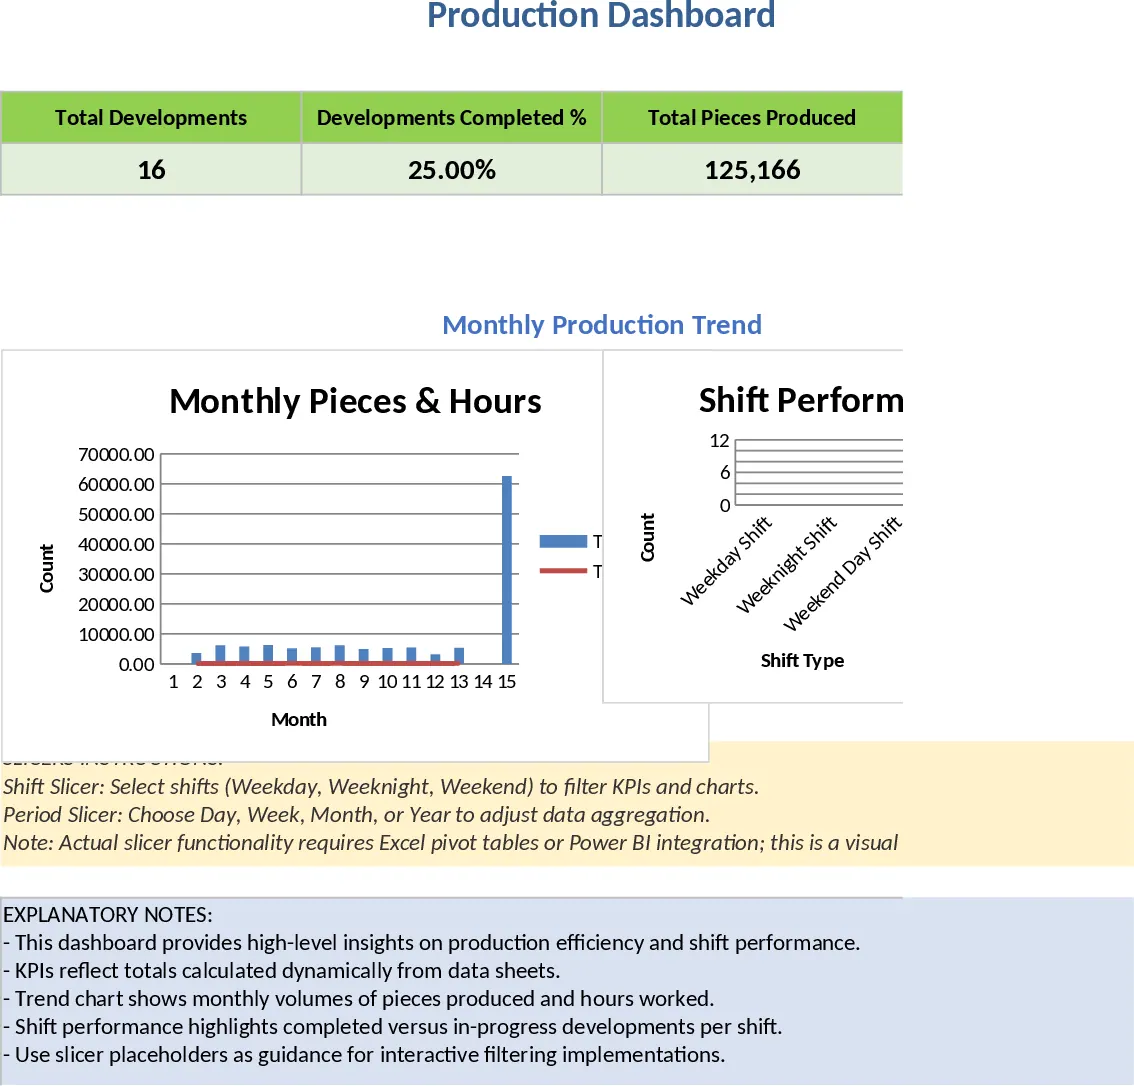
Multi-Shift Production Piece Count and Earned Hours Performance Template
Monitor daily piece counts and attained hours across shifts and development projects with comprehensive daily, weekly, and quarterly visual dashboards.
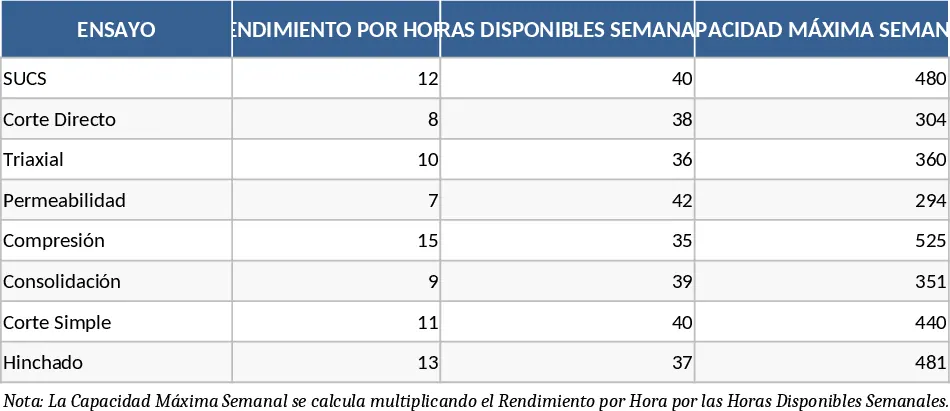
Laboratory Capacity and Production Tracking Template
Optimize laboratory throughput by tracking test capacity, weekly production goals, and real-time project progress with automated metrics.
Daily Multi-Line Production and Downtime Tracking Template
Monitor daily production output, efficiency, and downtime across multiple lines using automated pivot tables and interactive performance dashboards.