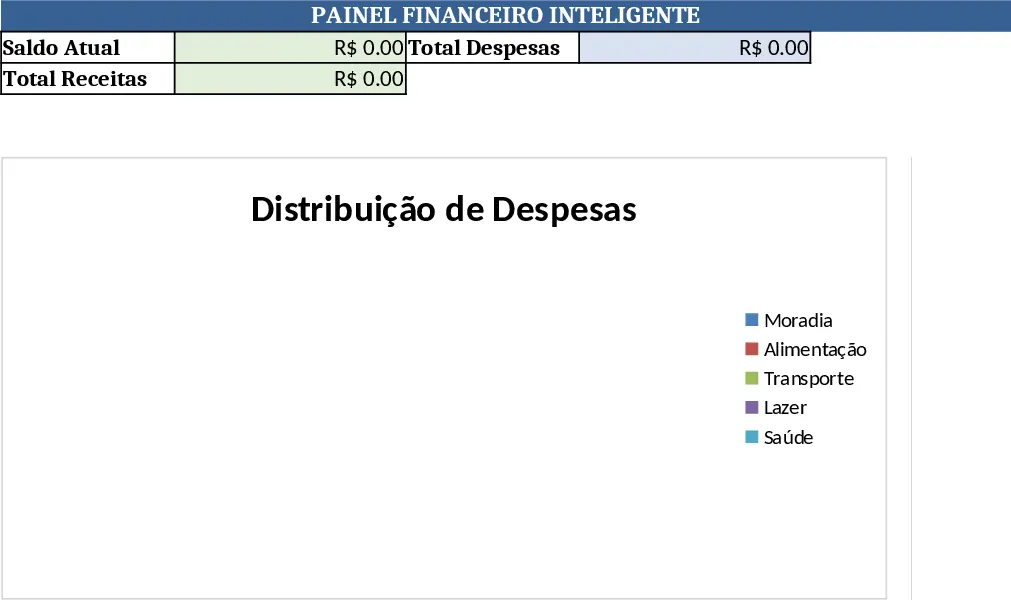
Personal & Business Budget Tracker with Variance Analysis Template
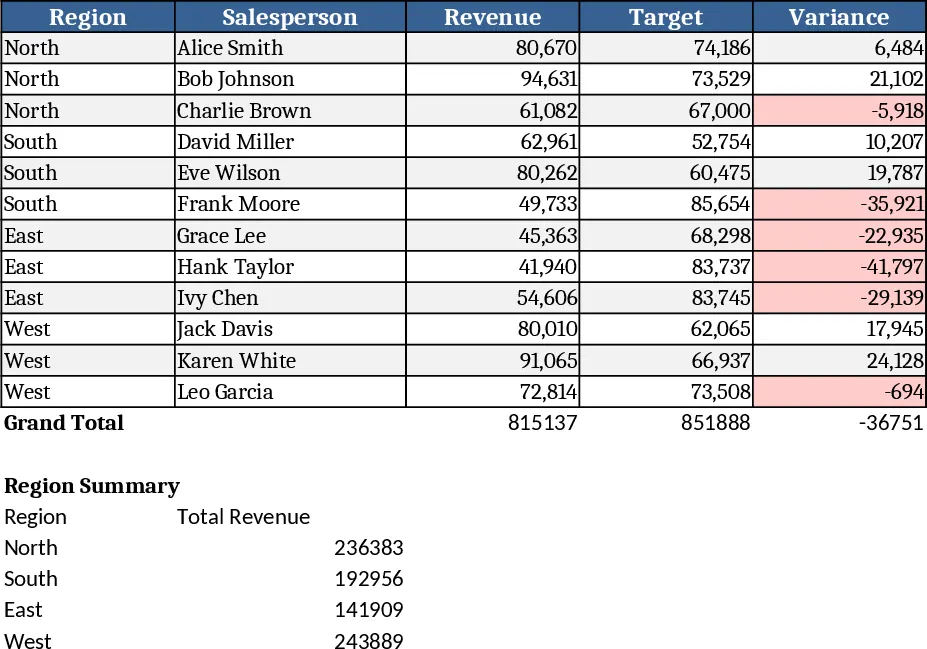
This Excel template combines a personal and business budget workbook into a single, easy‑to‑use file. It opens to a Dashboard sheet that shows total budgeted versus actual spend, a variance column, and two pie charts – one for personal expenses and one for business costs. Below the dashboard are three data entry sheets: Income, Planned Expenses, and Actual Expenses. Each sheet uses dropdown lists for expense categories (e.g., Housing, Marketing, Travel) and date pickers, while formulas automatically sum amounts by month and by category. Conditional formatting highlights any line where the actual spend exceeds the budgeted amount, turning the cell red for instant visual alerts. The monthly summary table rolls up all data, giving you a quick view of budget performance, percentage of budget used, and a variance figure for each month.
The template solves the common headache of juggling separate spreadsheets for personal and business finances. By consolidating both streams, you can see how cash flows interact, spot overspending early, and make data‑driven adjustments before the month ends. It saves time that would otherwise be spent copying data between files, manually calculating variances, or creating charts from scratch. The visual cues and auto‑totals let you focus on strategic decisions – like reallocating marketing spend or trimming discretionary personal costs – rather than on tedious number‑crunching.
Ideal for freelancers, small‑business owners, and anyone who wants a clear picture of both household and company finances. Whether you’re preparing quarterly tax estimates, planning a new product launch, or simply trying to stick to a personal savings goal, this workbook gives you a single source of truth. It tracks every inflow and outflow, categorizes each transaction, and produces month‑by‑month performance metrics that are instantly understandable.
How to use
- Open the file and fill in the Income sheet with all expected revenue streams, assigning dates and amounts.
- List your planned spending in the Planned Expenses sheet, choosing a category from the dropdown and entering the budgeted amount for each line item.
- As the month progresses, record actual transactions in the Actual Expenses sheet, using the same categories.
- Return to the Dashboard to see totals update automatically, watch the variance column turn red if you overspend, and review the pie charts that illustrate where your money goes.
Expected benefits include a noticeable reduction in manual spreadsheet work, quicker identification of budget gaps, and clearer insight into spending patterns, helping you stay on track without endless data entry.
Similar Templates Recommendation
Personal Monthly Budget and Expense Tracker with Transaction Log and Top Merchants Template
Take control of your finances by tracking daily expenses and income against monthly budgets with automated variance analysis and visual dashboards.
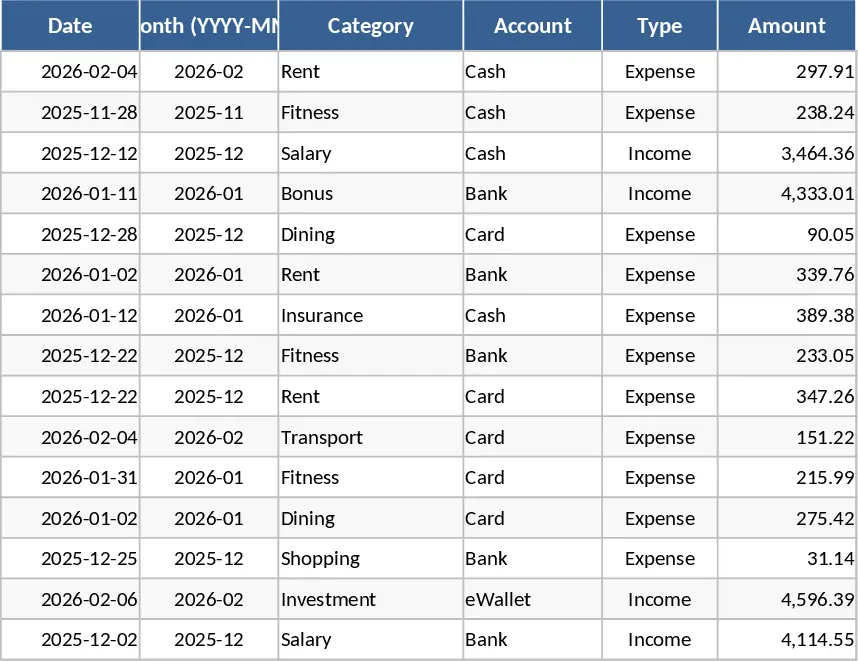
Personal Finance & Emergency Fund Calculator Template
Track income, expenses, and calculate an emergency fund target to boost personal savings and financial security.
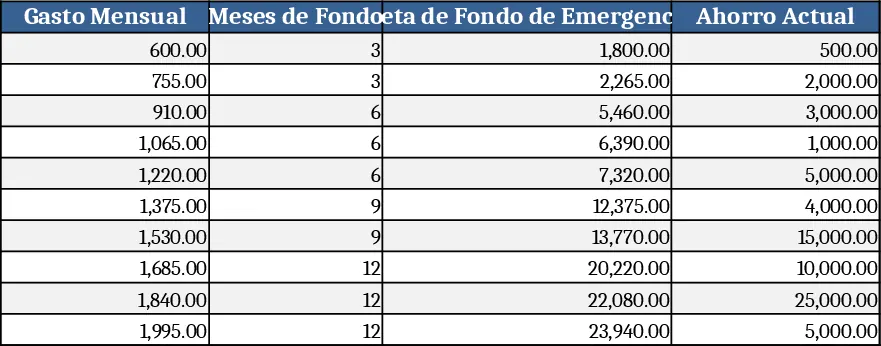
Excelmatic Intelligent Budget Model Template
A dynamic Excel budgeting template that lets you plan, track, and forecast expenses and revenues with smart calculations and visual summaries.