California Colleges Directory Template
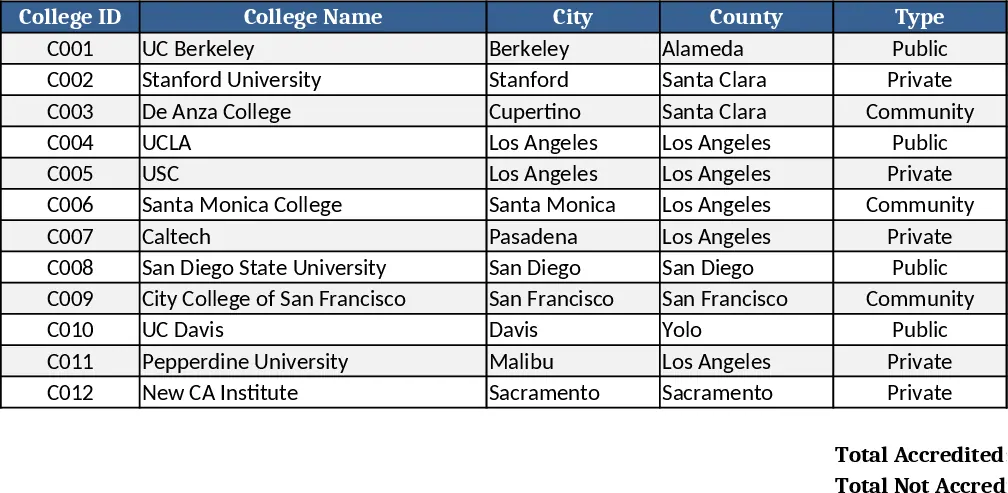
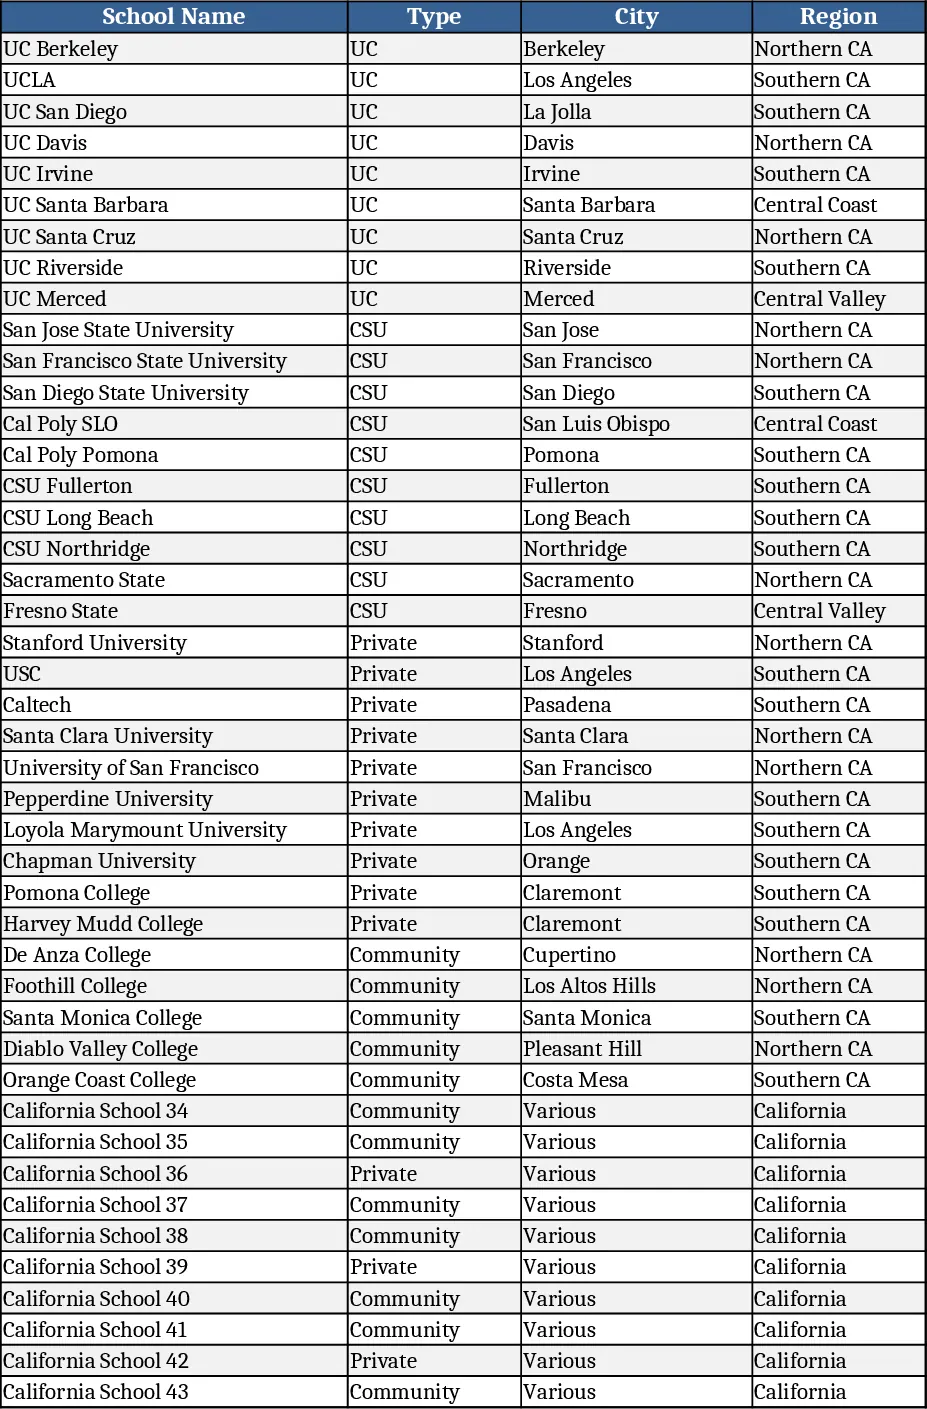
The California Colleges Tracker is a multi‑sheet Excel workbook designed to help you collect, compare, and visualise key information about every higher‑education institution in the Golden State. The main College List sheet holds rows for each school with fields such as College Name, Type (Public, Private, Community – selectable via dropdown), City, Tuition (in‑state/out‑of‑state), Average SAT/ACT, Acceptance Rate, Major Programs, Campus Size, and Website link. A second Comparison sheet lets you filter by type, tuition range, or program and automatically generates a pivot table that ranks schools side‑by‑side. The Dashboard sheet pulls the pivot data into easy‑to‑read bar and pie charts, giving you a quick visual snapshot of tuition distribution, acceptance trends, and program popularity.
This template solves the common headache of juggling multiple web pages, PDFs, and notes when researching colleges. By centralising data in one place, you can instantly see which schools fit your budget, academic goals, and location preferences, making application planning far more efficient. The built‑in charts highlight patterns—like which regions have the lowest tuition or which majors are most offered—so you can make data‑driven decisions without manual calculations.
Ideal for high‑school seniors, college‑counselors, and parents, the workbook streamlines the research phase of the college‑selection process. Whether you’re narrowing down a shortlist, preparing a presentation for a guidance meeting, or simply tracking deadlines, the template provides a clear, editable record that can be shared or printed.
How to use
- Open the College List sheet and start entering schools you’re interested in, selecting the appropriate Type from the dropdown and filling in the numeric fields.
- Switch to the Comparison sheet, apply filters (e.g., tuition < $20,000, Public only) and watch the pivot table update instantly.
- Go to the Dashboard to view the generated charts; adjust the source range if you add more schools.
- Export the Dashboard as a PDF or copy the charts into a presentation for easy sharing.
Expected benefits: saves hours of manual data gathering, reduces errors, and gives you a visual overview that speeds up decision‑making.