School Principal KPI Dashboard Template
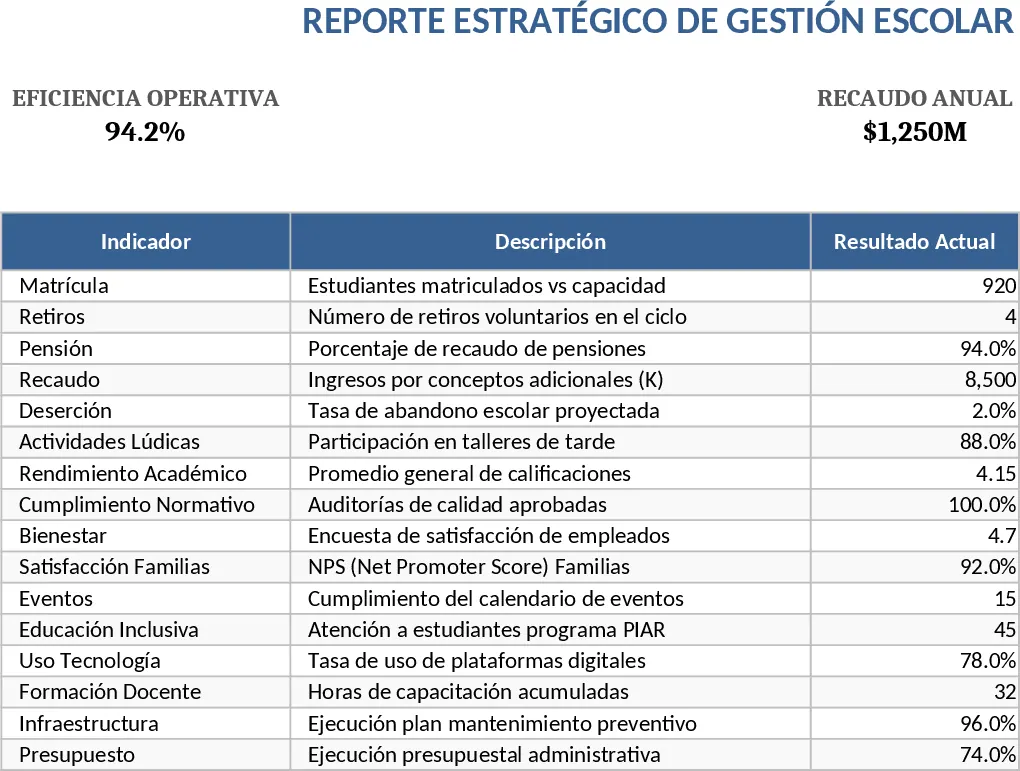
This Excel template is designed especially for school rectors who want a quick, reliable way to monitor the health of their institution. The workbook is organized into three main sheets: Data Input, Calculations, and Dashboard. In the Data Input sheet you’ll find a table with 16 rows, each representing a specific KPI such as student attendance rate, graduation rate, teacher‑to‑student ratio, budget utilization, and extracurricular participation. For each KPI you can enter the raw numbers (e.g., total enrolled students, days attended, budget spent) and the template’s pre‑written formulas automatically calculate the percentages, trends, and targets. The Calculations sheet holds all the intermediate formulas, hidden from casual users but easy to audit if needed. Finally, the Dashboard sheet presents the results in clean charts, traffic‑light indicators, and summary tables that update instantly as you change the input data.
Why use this template? School leaders often spend hours gathering data from different departments, manually computing ratios, and creating ad‑hoc reports for board meetings. This workbook eliminates the repetitive work by centralizing all KPI data in one place and applying the correct Excel functions (SUM, AVERAGE, IF, VLOOKUP, etc.) automatically. It gives you a clear visual snapshot of school performance, highlights areas that need attention, and supports data‑driven decision‑making. Whether you are preparing a quarterly report, planning resource allocation, or simply keeping an eye on day‑to‑day operations, the template saves time and reduces the risk of calculation errors.
The primary users are school rectors, vice‑principals, and administrative staff responsible for performance monitoring. It is also useful for education consultants who need a standardized way to assess multiple schools. The scenario is any situation where a school wants to track a set of predefined KPIs on a regular basis—monthly, quarterly, or annually—without building a new spreadsheet from scratch each time.
How to use
- Open the workbook and go to the Data Input sheet. Fill in the raw numbers for each of the 16 KPI rows (e.g., total students, total absences, budget items). Use the drop‑down lists where provided to select the reporting period or category.
- Switch to the Calculations sheet if you need to adjust any formula logic or add notes; otherwise, leave it untouched.
- Navigate to the Dashboard sheet to see the automatically generated charts, traffic‑light status indicators, and summary tables reflecting your inputs.
- Export or print the Dashboard page for meetings, or share the workbook with stakeholders for collaborative updates.
Expected benefits: you’ll spend far less time on manual calculations, get consistent KPI reporting across periods, and gain a visual overview that helps you spot trends and act quickly. This template turns raw school data into actionable insights with just a few clicks.
Similar Templates Recommendation
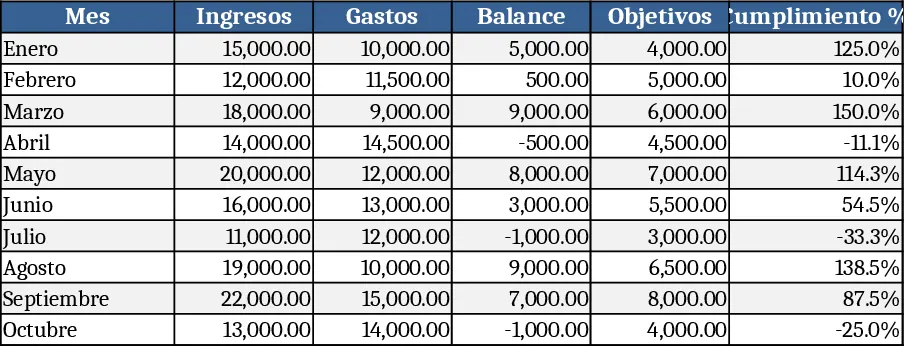
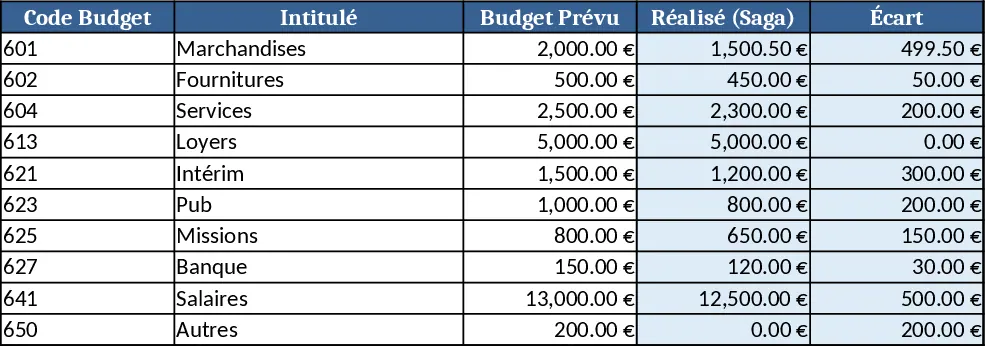
Formula-Enabled Data Table Template
A ready‑to‑use Excel workbook where you paste your data and built‑in formulas instantly calculate key metrics and insights.
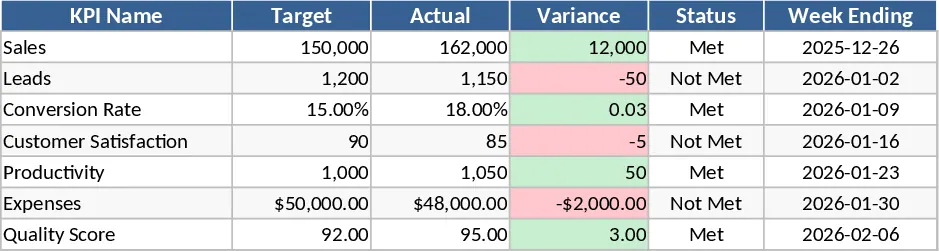
Weekly KPI Tracker Template
Monitor your team's weekly performance metrics and visualize progress against targets with this comprehensive KPI tracking dashboard.
Business Dashboard Template
A customizable analytics dashboard template that lets you consolidate key metrics, visualize trends, and monitor performance at a glance.