Tomorrow Shipping Scheduling Command Center Dashboard Template
The Tomorrow Shipping Dispatch Command Center Excel template is built as a single‑workbook solution that turns raw trip data into an instant, interactive operations dashboard. The workbook contains three main sheets: Data Input, Status Engine, and Dashboard. In the Data Input sheet you enter the core columns – Trip No, Boat Name, Captain, Planned Departure Time, Planned Arrival Time, Actual Depart Time, and Actual Arrival Time. As soon as you type a value, the Status Engine sheet calculates a dynamic Status column using built‑in formulas: it flags delayed trips (⚠️ Delayed) when the planned departure has passed without an actual departure, marks trips as ✅ Departed once the actual depart time is entered, and shows 🏁 Completed when the actual arrival time is filled. Conditional formatting highlights normal, delayed, and completed rows with bright green, vivid red, or neutral tones.
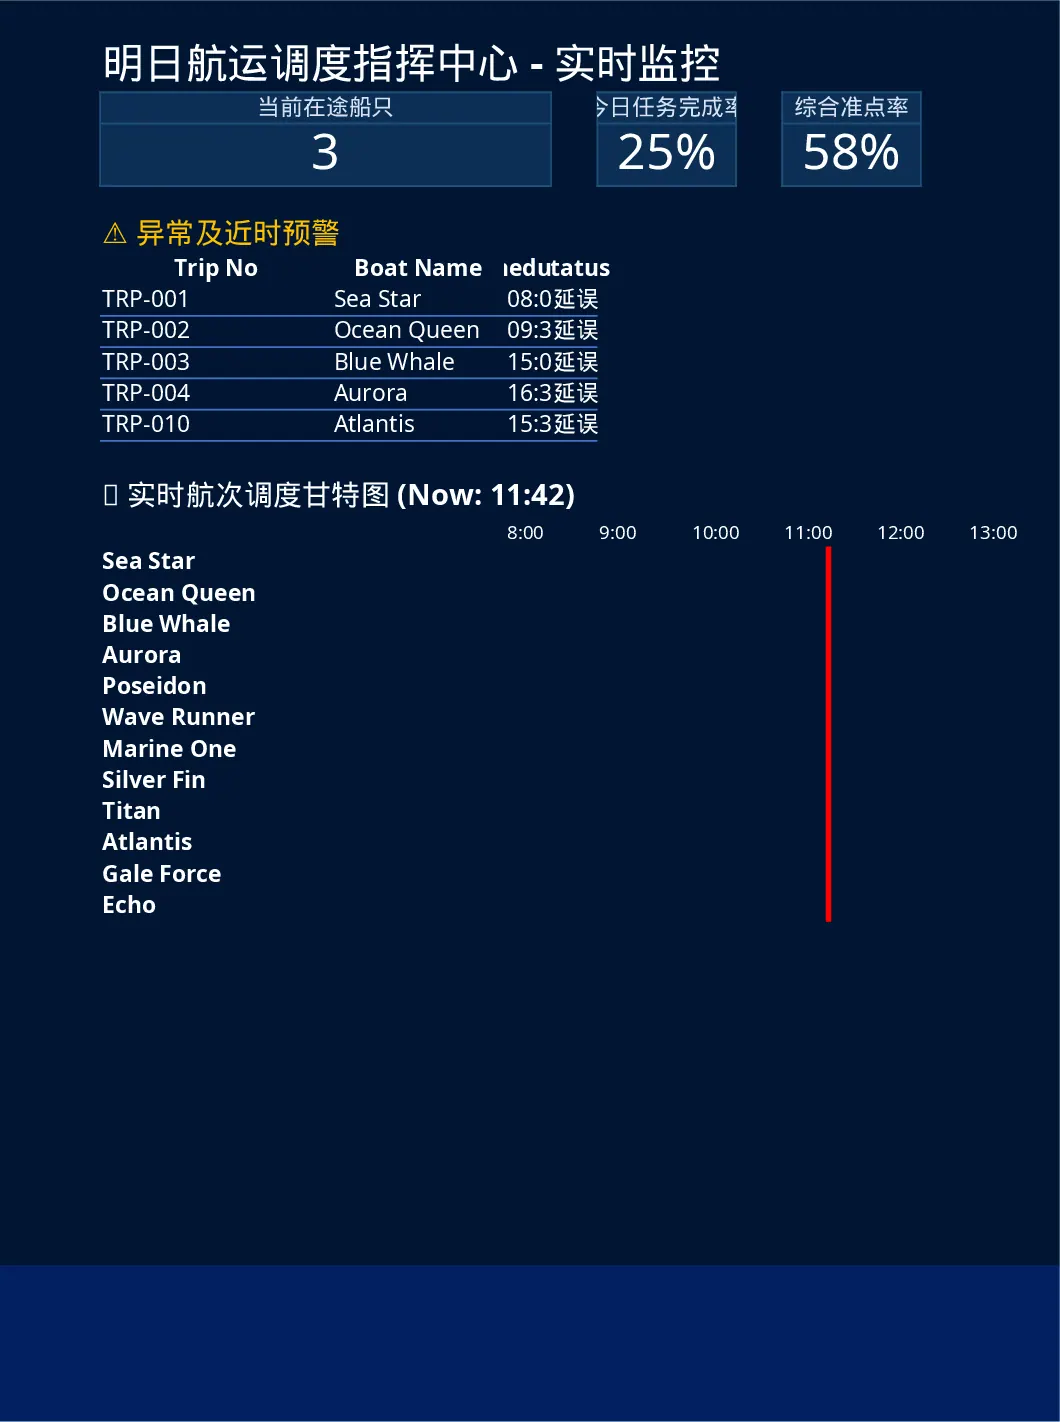
The Dashboard sheet sits at the top of the workbook and refreshes automatically. It displays three KPI cards – Current In‑Transit Vessels, Today's Completion Rate (%), and On‑Time Rate – each pulling live counts from the Status Engine. Below the KPIs a dynamic Gantt chart visualizes every voyage on a timeline, with a moving red "Now" line that slides with the system clock, making it easy to spot which trips are active, upcoming, or finished. An Exception Alert section lists any voyages flagged as delayed or those scheduled to depart within the next 15 minutes but still missing actual departure data, giving supervisors a quick watch‑list for immediate action.
This template is ideal for shipping line operations managers, fleet coordinators, and logistics analysts who need a quick, no‑code way to monitor vessel movements and performance throughout the day. It solves the common pain of manually reconciling schedule spreadsheets, reduces the risk of missing delays, and provides a visual, at‑a‑glance health check of the fleet. By consolidating data entry, status calculation, and visual reporting in one file, teams can focus on decision‑making rather than data wrangling.
How to use
- Open the workbook and go to the Data Input sheet. Paste or type your CSV rows, ensuring the required columns are filled.
- The Status column updates automatically; watch the color‑coded flags appear as you enter actual times.
- Switch to the Dashboard sheet to see KPI cards refresh, the Gantt chart redraw, and any exceptions appear in the alert box.
- Adjust the date range filter on the dashboard (if needed) to focus on today’s operations or a custom window.
Expected benefits: immediate visibility into fleet performance, faster identification of delays, and a streamlined reporting process that saves hours of manual spreadsheet work each day.