Cost and Expense Matrix Profitability Analysis Template
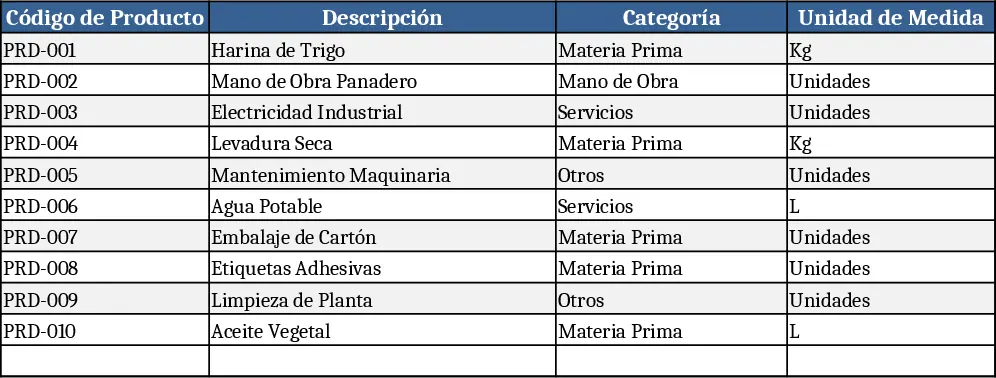
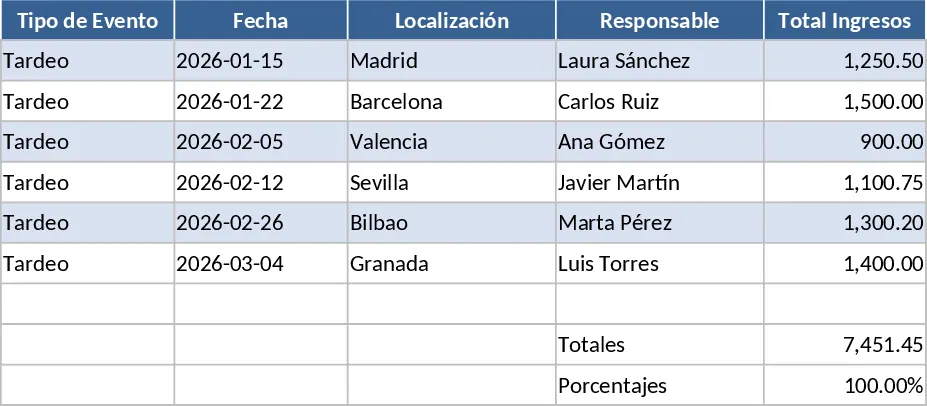
This Excel template is organized into five linked sheets: Input Data, where you list each product or service, its revenue, variable and fixed cost items, and the reporting period; Cost Matrix, a grid that lets you assign each cost to predefined categories using dropdowns; Expense Matrix, a similar table for overhead and operating expenses; Profitability Summary, which automatically calculates gross profit, net profit, contribution margin, and ROI for every line item; and Charts & Dashboard, a set of visualizations such as heat‑maps, bar charts, and waterfall graphs that highlight the most profitable segments and the biggest cost drivers.
By consolidating all financial inputs in one place, the template eliminates the tedious manual calculations that usually accompany profitability studies. It instantly shows where margins are thin, which expense categories are inflating costs, and how changes in pricing or cost structure affect the bottom line. This clarity helps you prioritize cost‑reduction initiatives, set realistic pricing strategies, and present data‑driven insights to stakeholders without building complex models from scratch.
The tool is ideal for financial analysts, accountants, small‑business owners, and product managers who need a quick yet comprehensive view of their cost structure. Whether you are preparing a quarterly review, evaluating a new product launch, or simply tightening the budget, the template adapts to any industry by letting you customize cost and expense categories to match your own chart of accounts.
How to use
- Open the Input Data sheet and enter each product/service, its expected revenue, and the associated cost items. Use the provided dropdowns to select cost and expense categories.
- Switch to the Cost Matrix and Expense Matrix sheets to verify allocations; the formulas will automatically roll the numbers into the summary.
- Review the Profitability Summary sheet to see calculated margins, total cost breakdowns, and ROI figures for each product.
- Explore the Charts & Dashboard sheet to visualize profit hotspots and cost‑driven trends; adjust filters to drill down by period or category.
Expected benefits: You’ll spend far less time consolidating numbers and get clearer insight into profit drivers, enabling faster, more informed decisions.