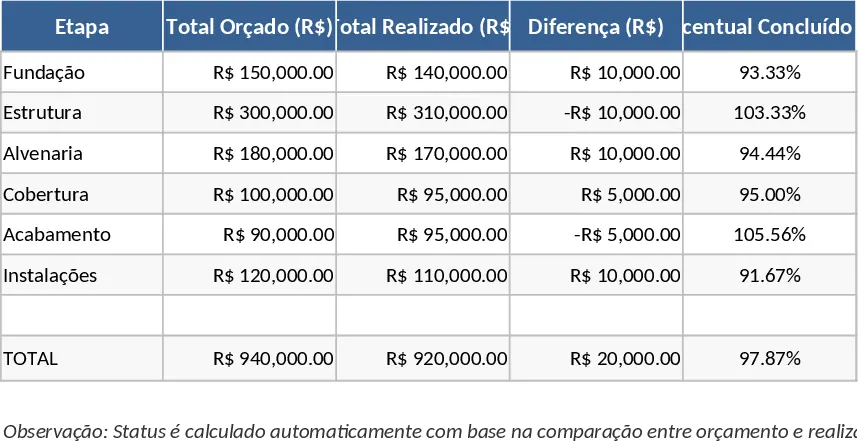
Construction Company Management Dashboard Template
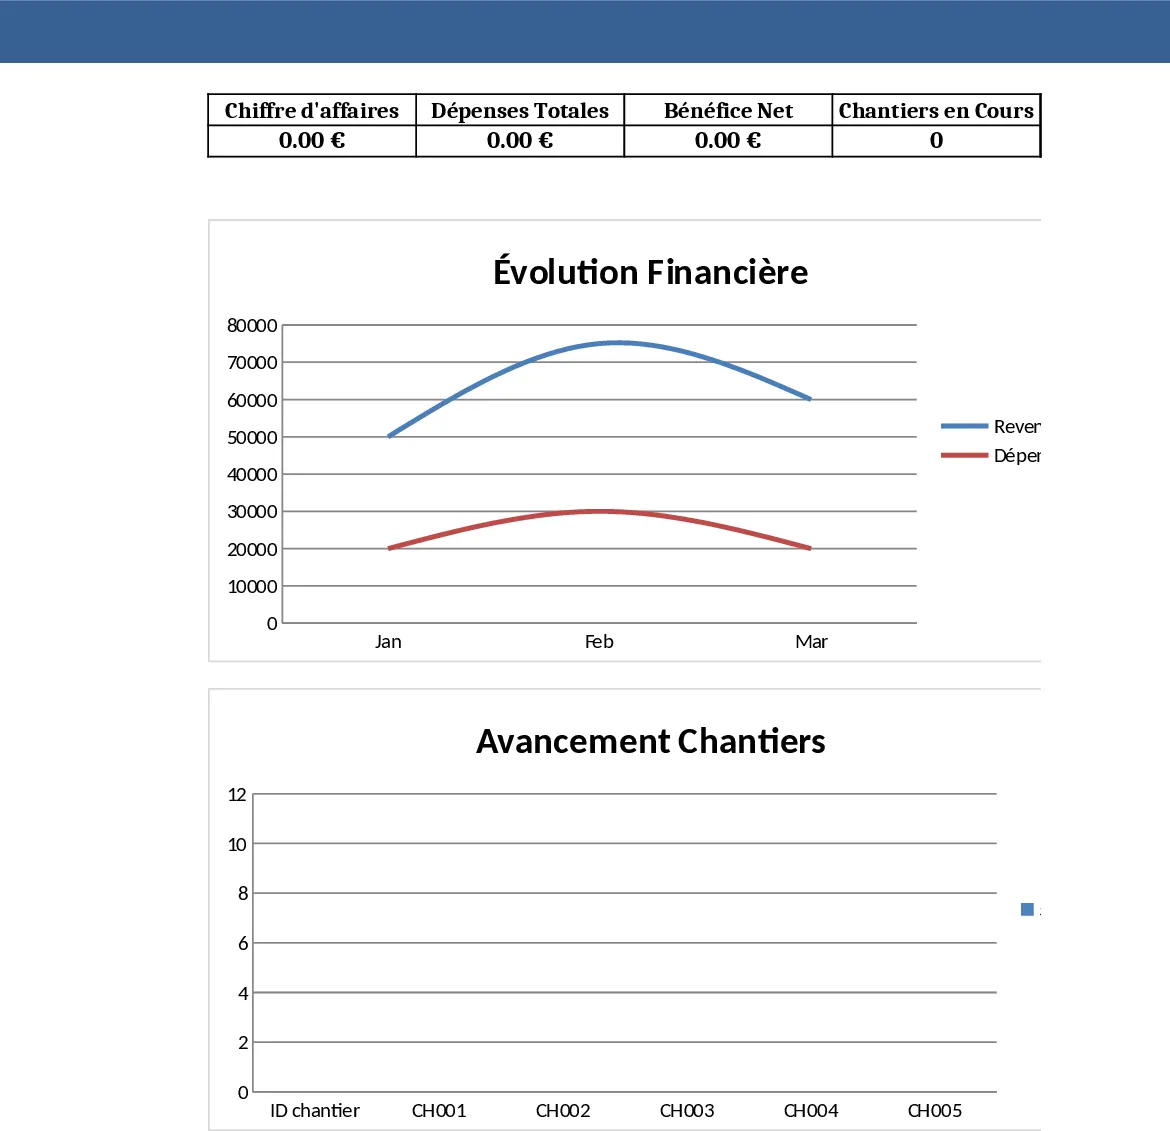
This Excel solution is built especially for construction and public works companies that need a single, ready‑to‑use file to monitor every aspect of their business. The workbook is divided into seven clearly labeled sheets: Tableau de Bord presents the most important KPIs – total turnover, total expenses, net profit, active projects count and average progress – together with dynamic charts that update as data changes. Chantiers records each site with fields for ID, name, location, client, start and planned end dates, budget, actual cost, progress percentage, responsible manager and status, and automatically calculates budget variance and flags overruns. Dépenses logs every expense by date, linked project, type (materials, labor, fuel, etc.), amount and supplier, summarising totals per project. Revenus captures invoicing details, payment status and links to the corresponding project. Employés tracks staff names, positions, salaries, assigned sites and hours worked. Matériel inventories equipment, condition, assigned site, maintenance cost and availability. Finally, Fournisseurs stores supplier contacts, categories and order history. All tables are formatted as Excel structured tables, with drop‑down lists for statuses and types, and conditional formatting that highlights budget breaches or overdue payments.
The template solves the daily headache of juggling multiple spreadsheets or manual calculations. By centralising project data, financial flows, human resources and assets, managers gain instant visibility into profitability, cash‑flow health and operational bottlenecks. It eliminates duplicate entry, reduces errors from manual formulas, and turns raw numbers into actionable insights through the dashboard’s charts. Whether you run a small contractor office or oversee a medium‑size BTP firm, this workbook gives you a professional reporting tool without requiring advanced Excel skills.
With this file you can continuously monitor the financial performance of each chantier, compare planned versus actual costs, see which projects are lagging, and keep an eye on employee workload and equipment utilization. The automatic calculations (SUM, AVERAGE, IF, XLOOKUP) keep totals up‑to‑date, while conditional alerts draw your attention to critical issues such as budget overruns or delayed payments. The result is a clearer picture of where resources are spent, which suppliers are most reliable, and how quickly projects progress toward completion.
How to use
- Open the workbook and start by filling the Chantiers sheet: enter a unique ID, project name, client, dates, budget and assign a manager. The sheet will instantly show the budget variance and flag any overrun.
- Record every cost in the Dépenses sheet, selecting the related chantier from the drop‑down list and choosing the expense type. Totals per project update automatically.
- Log incoming payments in the Revenus sheet, marking each as "payé" or "en attente"; the dashboard will reflect cash‑flow status.
- Update the Employés and Matériel sheets as staff shift sites or equipment undergoes maintenance. Their hours and costs feed into the overall KPI calculations.
By following these steps the dashboard on the first sheet refreshes instantly, showing you up‑to‑date revenue curves, expense breakdowns and project progress bars. Expected benefits include a noticeable reduction in time spent on manual reporting, fewer calculation errors and a more confident, data‑driven decision‑making process.
Similar Templates Recommendation
Construction Project Control & Financial Management Template
A comprehensive spreadsheet to track construction projects, finances, expenses, staff, and performance dashboards.
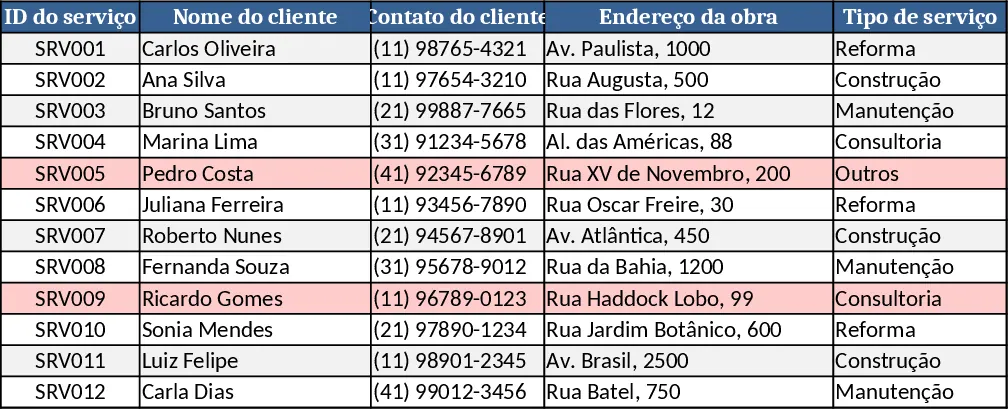
Construction Project Financial Tracker Dashboard Template
Track completed construction projects, monitor expenses and income, and view a visual dashboard of your company's financial performance.
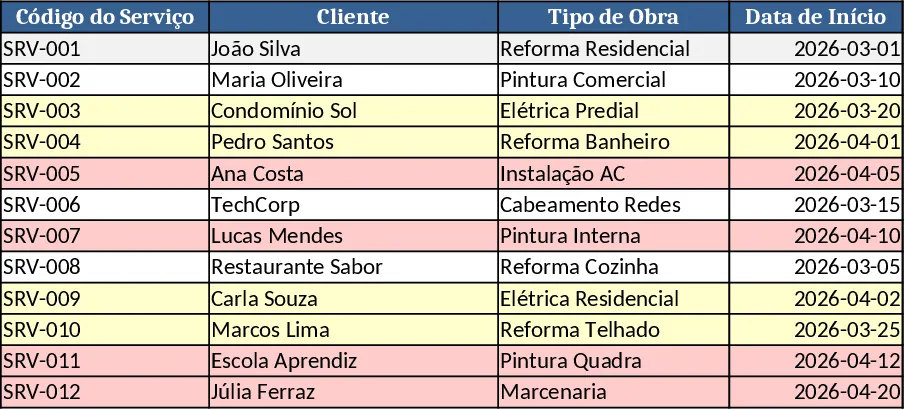
Comprehensive Construction Project Budget Template
Track construction costs, manage material and labor expenses, and monitor your project budget with this professional and functional template.