Mitutoyo U-Wave ROI Analysis and IQC Measurement Savings Template
The ROI Analysis for Mitutoyo U-Wave Implementation is a premium financial modeling tool designed to bridge the gap between technical efficiency and corporate profitability. In many quality control environments, manual data entry from calipers is a significant bottleneck that introduces human error and labor waste. This template provides a structured, professional framework to quantify the exact value of transitioning to a wireless data transmission system, making it an essential asset for Quality Managers and Operations Directors who need to justify technology investments to executive leadership.
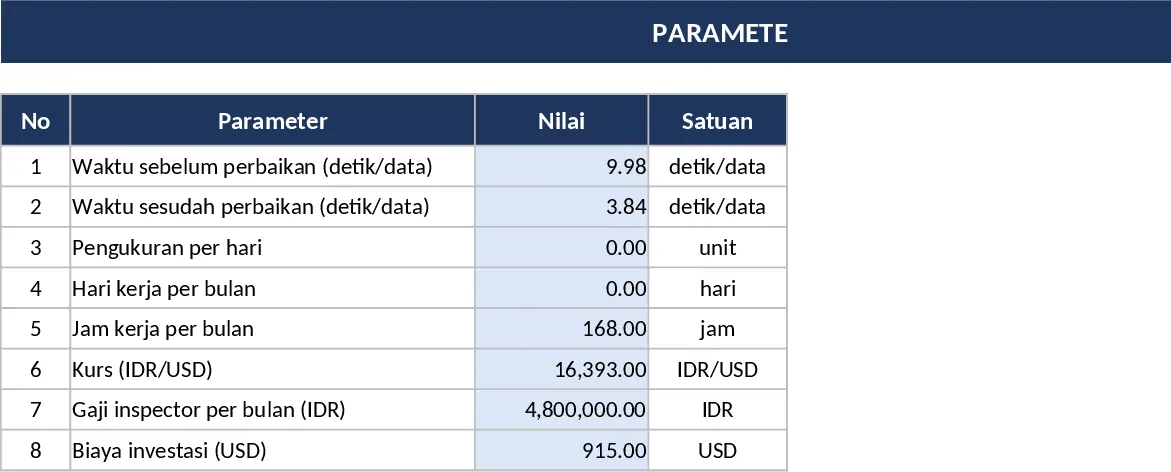
This template is organized into three high-performance sheets. The Input sheet features a modern, user-friendly interface with light blue editable fields and built-in data validation to ensure accuracy. Here, you can define parameters such as measurement time before and after improvement, daily measurement volume, labor rates, and total investment costs. The Calculation sheet serves as the engine of the template, utilizing dynamic formulas to translate time savings into monetary value. It automatically calculates monthly and annual savings, labor cost per hour, and critical financial indicators like ROI and Payback Period. Finally, the Executive Dashboard offers a futuristic, presentation-ready visual summary. It includes high-impact KPI cards for immediate insights and a suite of professional charts—including bar, line, donut, and waterfall charts—that provide a comprehensive view of your projected financial performance.
This tool is particularly useful for solving the challenge of 'vague benefits' in process improvement. Instead of simply stating that a tool is faster, you can demonstrate a concrete Payback Period in months and a percentage-based Return on Investment. It is ideal for Incoming Quality Control (IQC) scenarios, manufacturing engineering audits, and any department looking to digitize their measurement workflow. By automating the conversion of seconds saved into dollars earned, it removes the complexity of financial modeling and allows you to focus on operational excellence.
How to use this template:
- Navigate to the Input sheet and enter your current operational data, such as the seconds required per measurement and the inspector's monthly salary. Ensure you input the investment cost for the U-Wave hardware.
- Review the Calculation sheet to see the automated breakdown of time-to-cost conversion. Check the conditional formatting indicators to see if your ROI meets the green-light threshold (e.g., Payback < 24 months).
- Use the dropdown simulation tools on the Dashboard to test different scenarios, such as changes in measurement volume or labor costs, to see how they impact your bottom line.
- Export the Executive Dashboard as a PDF or include it directly in your management slide deck for a professional, data-driven presentation.
Expected benefits include significant time saved in financial reporting, reduced effort in manual calculations, and a much higher likelihood of project approval through clear, visual financial justification.