

Weekly Activity Report Template
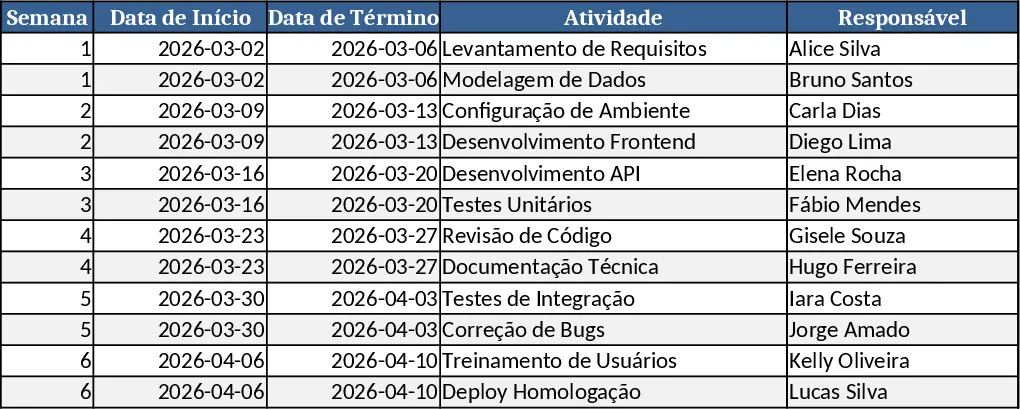
The Weekly Activity Report template is built on a single workbook with three interconnected sheets. The first sheet, “Activity Log”, contains a table where you paste or type each day's tasks, with columns for Date, Project/Area, Description, Hours Spent, and Status (Done, In‑Progress, Blocked). Dropdown lists keep entries consistent. The second sheet, “Summary”, pulls the raw data and automatically calculates totals, creates a pivot‑style overview of hours per project, and highlights any blocked items. The third sheet, “Report”, formats these insights into a ready‑to‑share PDF‑friendly layout, including a brief narrative section and visual charts.
With this structure you can turn a simple list of daily actions into a polished weekly report in minutes. The template eliminates the manual copying and pasting that usually eats up time, and it guarantees that every report contains the same key metrics: total hours, completed versus pending tasks, and any issues that need escalation. Because the calculations update instantly, you always see the latest numbers as you add new rows.
The template is ideal for team leaders, project coordinators, and anyone who needs to keep supervisors informed about weekly progress. Whether you are managing a software development sprint, a marketing campaign, or an operations shift, the same layout works. It also serves freelancers who must submit regular status updates to clients.
What you track with this workbook includes daily effort distribution, project‑level workload, task status trends, and any blockers that could affect deadlines. The summary sheet also flags days where hours exceed a predefined threshold, helping you spot overload early. All of this information is compiled into the final report page, which can be printed, emailed, or exported as a PDF with a single click.
The workbook also includes a few optional features that let you tailor it to your organization’s terminology. You can rename the project list, add custom status values, or insert additional columns such as “Client” or “Priority”. The built‑in conditional formatting colors rows that are overdue or flagged as high priority, making them stand out in the summary view. If you work with other tools like Microsoft Teams or Slack, you can copy the generated PDF directly into a channel, ensuring the whole team stays aligned.
How to use:
- Open the workbook and go to the “Activity Log” sheet. Enter each activity for the week, selecting the appropriate project and status from the dropdowns.
- Switch to the “Summary” sheet to review automatically generated totals, charts, and any highlighted issues. Adjust the date range filter if you need a custom view.
- Move to the “Report” sheet, fill in the optional narrative fields (Highlights, Risks, Next Steps), and press the “Generate PDF” button to create a clean report file.
- Share the PDF with stakeholders or attach the workbook for deeper analysis.
All data stays inside the Excel file, so no external services are required. You can store the workbook on a shared drive, OneDrive, or any cloud folder with version control, and the formulas will work the same way for every user.
By using this template you can shave off the hours normally spent formatting weekly updates, keep data consistent, and give managers a clear snapshot of progress without digging through raw logs.
Similar Templates Recommendation
Secondary School Results and Ranking Template
Track up to 200 secondary students' marks, auto‑calculate grades, averages, divisions and rankings in a clear, formatted sheet.

Couple Budget and Cash Flow Tracker Template
Track monthly income, expenses, and cash flow for a working couple, visualize budgets and savings goals in one spreadsheet.

Date Range and Internal Log Template
Create an Excel file with two columns for dates and internal notes, with colored rows for different date ranges.
