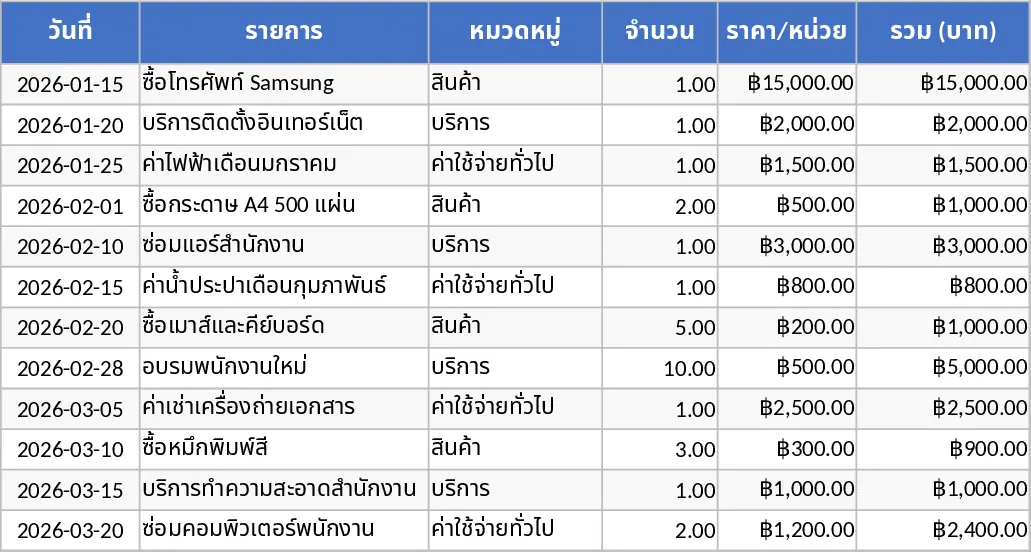
General Purpose Excel with Category Breakdown Template
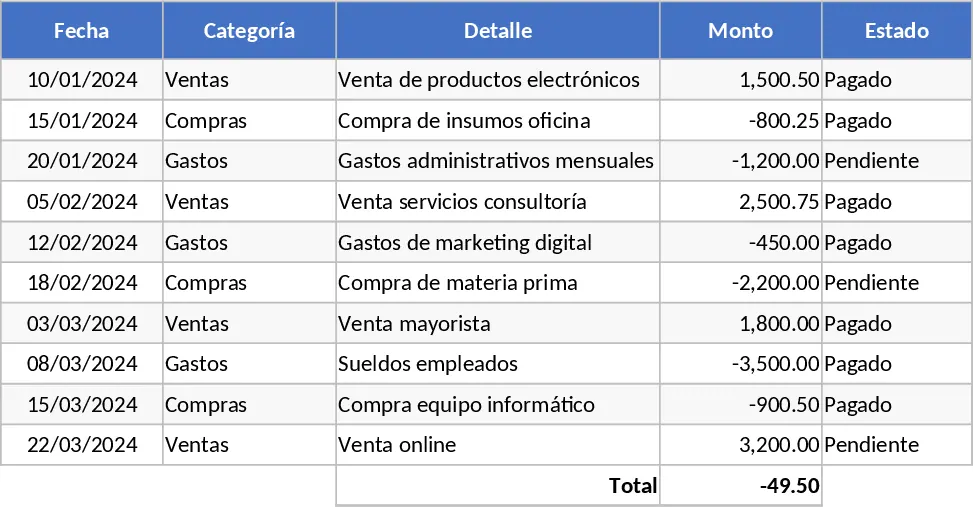
This all‑purpose Excel template is built with multiple sheets that cover data entry, calculations, and visual summaries. The first sheet provides a clean table where you can paste or type raw data, complete with drop‑down lists for standardized categories, date pickers, and conditional formatting to flag outliers. The second sheet runs formulas that automatically compute totals, averages, growth rates, and other key performance indicators. Finally, a dashboard sheet pulls those results into charts, pivot tables, and concise summary tables, giving you an at‑a‑glance view of your most important numbers.
Designed for anyone who works with numbers—whether you’re a small‑business owner, a project manager, a sales analyst, or an HR coordinator—this template solves the common headache of juggling multiple spreadsheets and manual calculations. By centralizing data entry and automating calculations, it eliminates duplicate work, reduces errors, and frees up time for strategic analysis. You’ll be able to spot trends, compare periods, and present findings to stakeholders without building complex formulas from scratch.
The template helps you track a wide range of information: sales figures, expense categories, employee hours, inventory levels, or any custom metric you define. Because the fields are customizable, you can adapt the layout to fit specific workflows while still benefiting from built‑in validation and instant visual feedback. The dashboard updates in real time, so any change in the source data instantly reflects in your charts and summary tables, keeping your reports always current.
How to use
- Open the workbook and go to the "Data Input" sheet. Fill in your rows, selecting options from the drop‑downs where applicable and ensuring dates are entered in the proper format.
- Switch to the "Calculations" sheet to review automatically generated totals, averages, and any custom formulas you’ve set up. Adjust any optional parameters (e.g., target thresholds) if needed.
- Visit the "Dashboard" sheet to see charts and summary tables refresh with your latest data. Export or copy these visuals for presentations or further analysis.
- Save the file as a new version for each reporting period to maintain a historical record.
Expected benefits: By using this template you’ll cut down the time spent on manual data consolidation, enjoy fewer calculation errors, and produce professional‑looking reports with just a few clicks, letting you focus on decision‑making rather than spreadsheet gymnastics.
Similar Templates Recommendation
General Purpose Excel with Data Validation Template
A versatile, customizable Excel template that you can adapt to track data, manage projects, or analyze metrics across any business need.
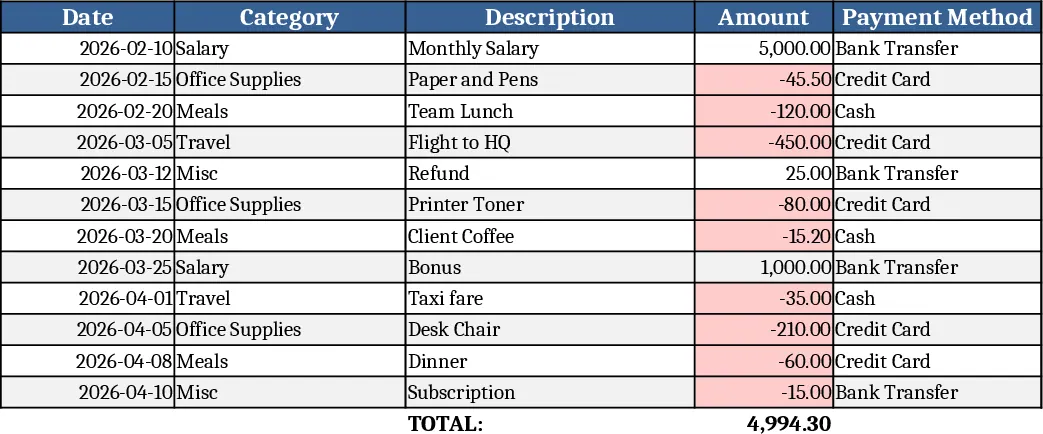
Data Extraction Chart Template
Create dynamic extraction charts in Excel to visualize data pulls, track trends, and generate instant visual reports.
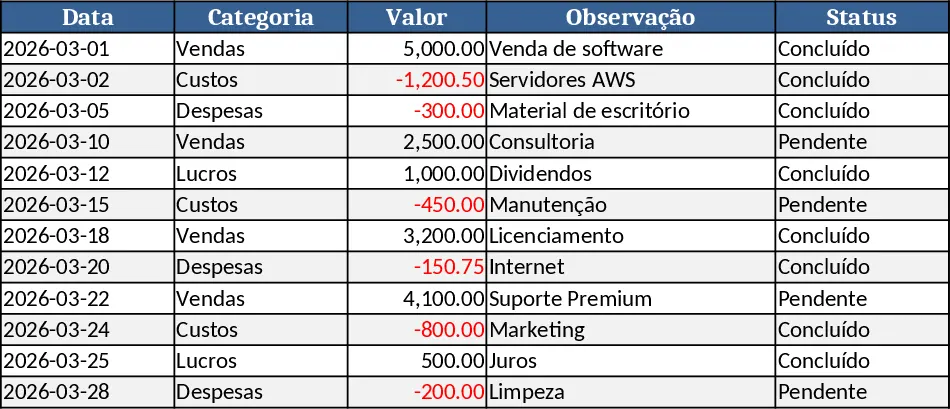
Calculation and Summary Report Template
A versatile Excel template that lets you input raw data, run calculations, and instantly generate clear summary tables and charts.