

Student Academic Records Dashboard Template
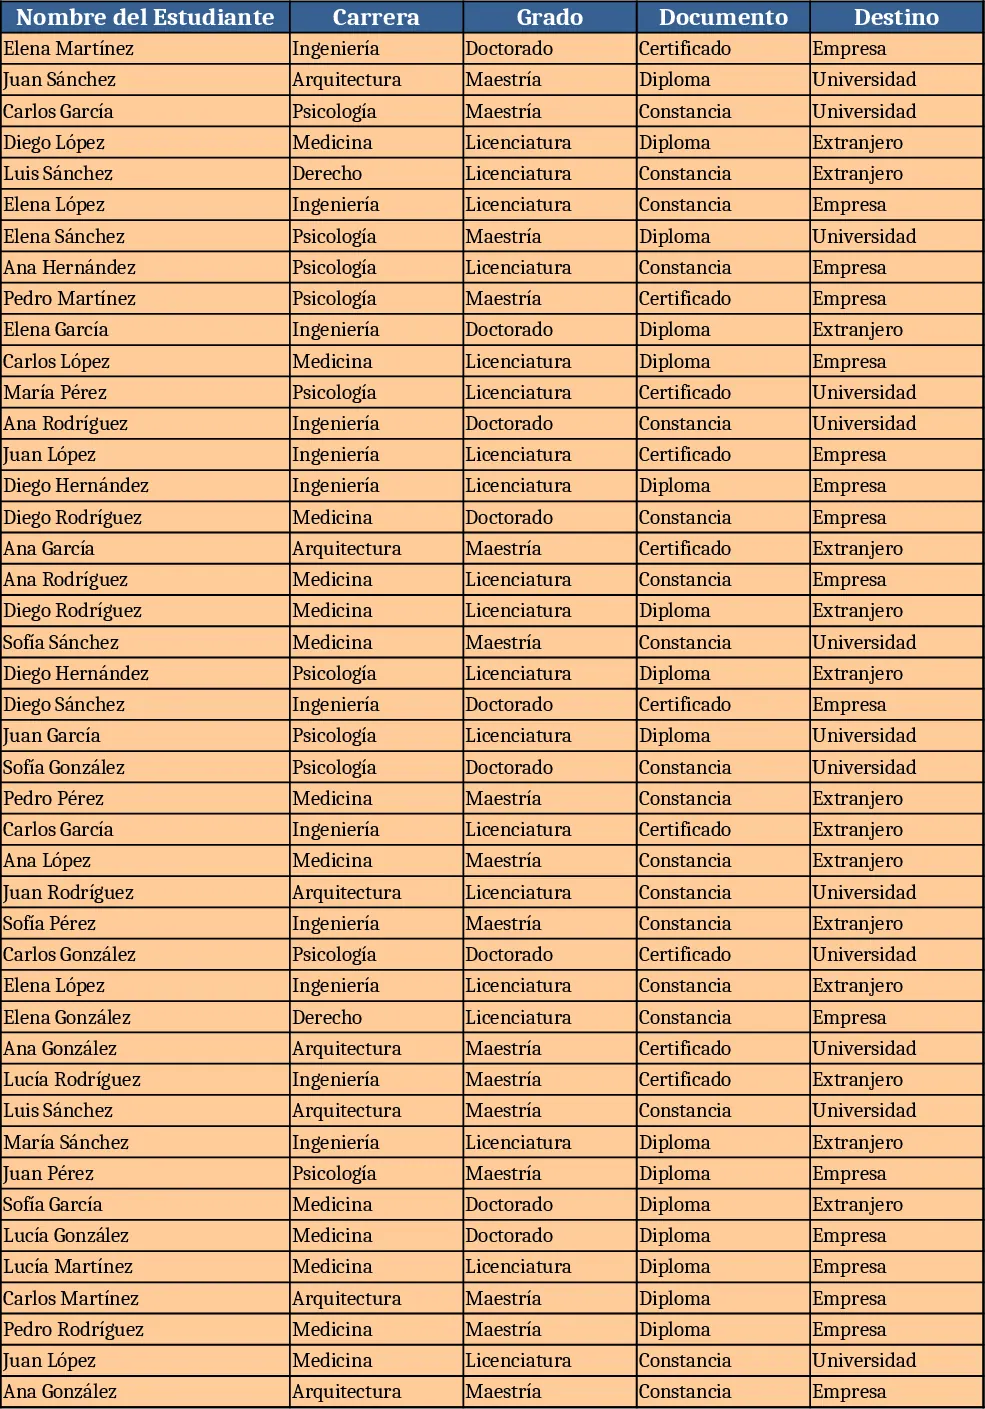
This template provides a ready‑made workbook for managing up to 100 academic documents in a single, organized table. The main sheet contains six columns – Student Name, Program, Grade, Destination, Date, and an optional Notes field – where you can enter each document’s details. A second sheet automatically generates pivot‑based charts that summarise the data: a bar chart of documents per program, a pie chart of grade distribution, and a timeline showing document flow over months. The layout is simple, with drop‑down lists for Program and Destination to keep entries consistent, and conditional formatting that highlights overdue dates.
The workbook solves the common headache of manually compiling and visualising academic paperwork. Instead of juggling separate spreadsheets or paper logs, you get a single source of truth that instantly produces visual summaries for meetings, accreditation reports, or departmental reviews. By automating the aggregation, you reduce errors, speed up reporting, and free up time for more strategic tasks such as curriculum planning or student support.
It is ideal for department administrators, faculty coordinators, and academic advisors who need to keep track of theses, research proposals, internship agreements, or any other student‑related documents. Whether you are preparing a quarterly status update for the dean or simply want to see how many students have submitted their final projects, this template gives you the numbers at a glance.
The workbook helps you monitor document volume, identify bottlenecks (e.g., many documents pending a specific destination), and produce polished charts for presentations. Because the data is structured, you can also export it to other systems or filter it for ad‑hoc queries without rebuilding the report each time.
How to use
- Open the "Data Entry" sheet and fill each row with the student’s name, their program, current grade, intended destination, and the date the document was received or submitted. Use the drop‑down menus for Program and Destination to maintain consistency.
- Once the rows are populated, switch to the "Charts" sheet – the pivot tables refresh automatically and the charts update to reflect the new information.
- If you need a different view, apply filters on the data sheet or adjust the pivot table fields (e.g., group by month or filter by a specific program).
- Export the charts as images or copy the summary tables into your reports with a single click.
Expected benefits: you’ll spend far less time compiling lists and creating charts manually, and you’ll have up‑to‑date visual insights ready for any stakeholder meeting.
Similar Templates Recommendation
Secondary School Results and Ranking Template
Track up to 200 secondary students' marks, auto‑calculate grades, averages, divisions and rankings in a clear, formatted sheet.

Couple Budget and Cash Flow Tracker Template
Track monthly income, expenses, and cash flow for a working couple, visualize budgets and savings goals in one spreadsheet.

Date Range and Internal Log Template
Create an Excel file with two columns for dates and internal notes, with colored rows for different date ranges.
