Rental Property vs Stock Market Investment Comparison Template
This comprehensive investment comparison tool is designed to help you make data-driven decisions between two of the most popular wealth-building strategies: real estate and the stock market. By modeling the unique mechanics of each—such as mortgage leverage and property appreciation versus compound stock growth—this workbook provides a side-by-side analysis of your potential net worth over a custom holding period.
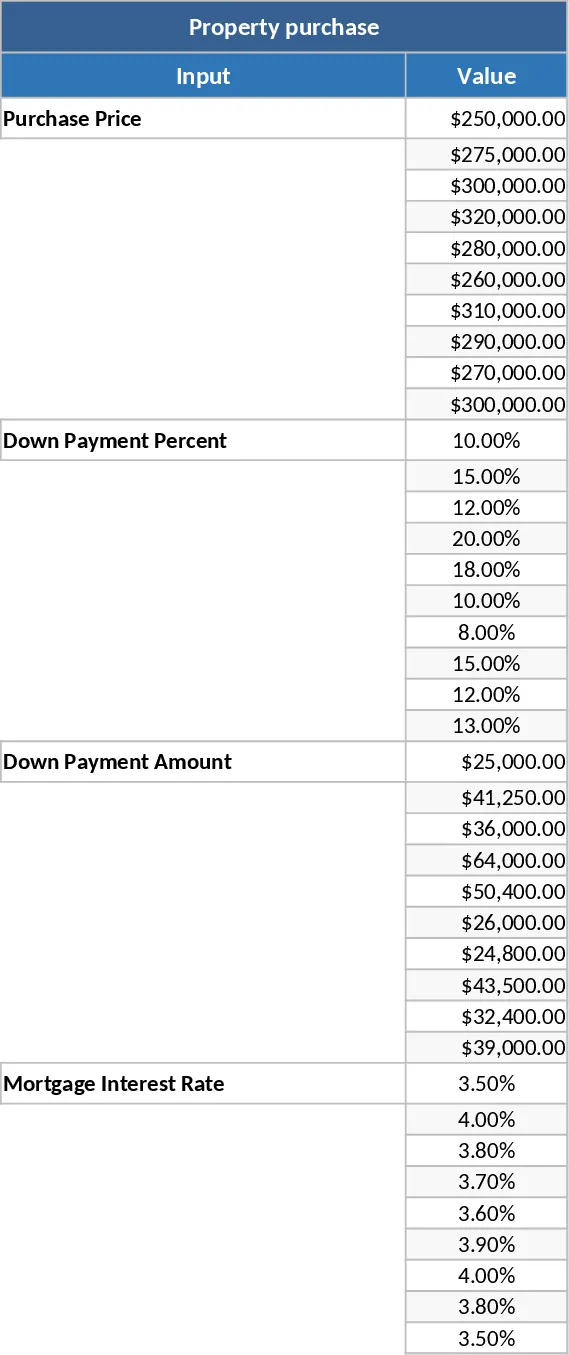
The template is organized into four specialized worksheets. The Inputs sheet serves as your control center, where you define everything from purchase price and mortgage rates to vacancy expectations and stock market return percentages. The Real Estate and Stock Model sheets perform the heavy lifting, calculating yearly mortgage balances, rental income, operating expenses, and the opportunity cost of investing your down payment into a portfolio instead. Finally, the Comparison dashboard aggregates this data into a clear summary, featuring ROI and CAGR metrics, a winner indicator, and visual charts comparing your projected net worth over time.
This tool is ideal for individual investors, financial advisors, or anyone weighing the pros and cons of becoming a landlord. It accounts for often-overlooked factors like closing costs, maintenance, property management fees, and capital gains taxes, ensuring your comparison is as realistic as possible. Whether you are looking to buy your first rental or deciding whether to sell an existing property to move into equities, this template provides the clarity needed to optimize your portfolio.
How to use:
- Navigate to the Inputs sheet and enter your specific property details, including purchase price, down payment, and expected rental income.
- Adjust the Stock Investment and General sections to reflect your alternative investment strategy and inflation expectations.
- Visit the Comparison sheet to instantly view which investment yields a higher net profit and compare the growth curves through the built-in charts.
Expected benefits: Gain immediate clarity on complex investment scenarios and reduce the risk of emotional decision-making through objective financial modeling.