

Weekly Sales Meeting Tracker & Dashboard Template
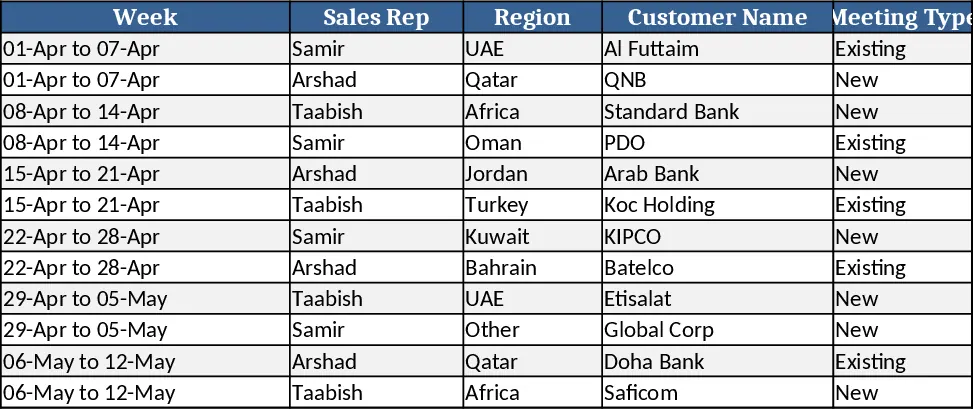
The Excel template is organized into three main tabs: a Weekly Tracker, a Planned vs Actual sheet, and a Management Dashboard. The Weekly Tracker lists each sales rep (Samir, Arshad, Taabish) in rows, with columns for Week (starting April 1 2026), Region (drop‑down of UAE, Bahrain, Oman, Jordan, Turkey, Kuwait, Qatar, Africa, Other), Customer Name, Meeting Type (New or Existing), and a simple checkbox to mark the meeting as completed. A separate column captures the number of leads generated from each meeting. The sheet automatically calculates the weekly meeting count, the percentage of the 15‑meeting target achieved, and the lead‑to‑meeting conversion rate for each rep. The Planned vs Actual sheet mirrors the same structure but adds columns for Planned Meetings and a formula that highlights any shortfall between planned and actual visits. The Management Dashboard pulls key metrics from the tracker: total meetings per region, average achievement percentage, total leads, and a visual bar chart that shows each rep’s weekly performance. A concise summary table lists the top customers visited each week, making it easy for leadership to see where effort is focused.
This template solves the common pain of excessive data entry while still providing the insight needed for performance reviews. By limiting required inputs to the essential fields—customer name, region, meeting type, and leads—the sales team can spend more time on the road and less time on paperwork. The built‑in calculations and visual dashboard give managers a quick, at‑a‑glance view of regional coverage and lead generation without digging through raw data. It is ideal for sales managers overseeing a small team that needs to hit weekly meeting quotas and demonstrate tangible results to senior leadership.
The template helps track weekly meeting volume, target attainment, lead generation, and the balance between new and existing customer interactions. It also records planned meetings for the upcoming week, allowing a direct comparison with actual outcomes. This dual view highlights scheduling gaps early, enabling proactive adjustments. The regional drop‑down ensures data consistency and makes it simple to filter performance by market, supporting strategic decisions about resource allocation.
How to use:
- Open the Weekly Tracker tab and select the appropriate week, region, and sales rep from the drop‑downs; enter the customer name, choose New or Existing, and type the number of leads generated.
- In the Planned vs Actual sheet, copy the same customer details into the Planned Meetings columns for the next week; the sheet will automatically flag any variance once actual data is entered.
- Switch to the Management Dashboard to see updated charts and summary tables; the dashboard refreshes instantly as you fill in the tracker.
- Export or copy the dashboard view for presentation to the management team.
Expected benefits: minimal data entry saves time, weekly visibility drives accountability, and the visual dashboard streamlines reporting for leadership.
Similar Templates Recommendation
Secondary School Results and Ranking Template
Track up to 200 secondary students' marks, auto‑calculate grades, averages, divisions and rankings in a clear, formatted sheet.

Couple Budget and Cash Flow Tracker Template
Track monthly income, expenses, and cash flow for a working couple, visualize budgets and savings goals in one spreadsheet.

Date Range and Internal Log Template
Create an Excel file with two columns for dates and internal notes, with colored rows for different date ranges.
