UEFA Champions League Tracker Template
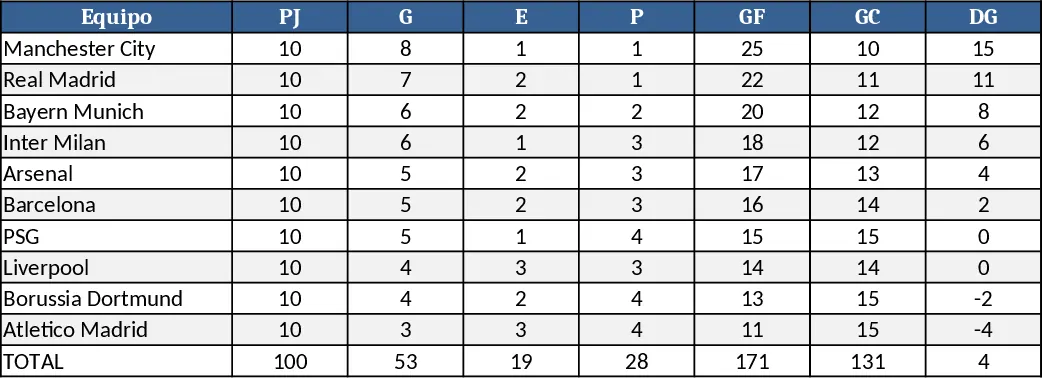
This template is built for anyone who follows the UEFA Champions League and wants a clear, organized view of the competition. It contains separate sheets for Group Stage, Knock‑out Rounds, Team Overview, and a Dashboard. In the Group Stage sheet you enter match dates, home and away teams, and final scores; the sheet automatically calculates points, goal difference, and ranks each group. The Knock‑out Rounds sheet captures two‑leg aggregate scores, away‑goal rules, and identifies the advancing team. The Team Overview sheet consolidates each club’s total matches, goals scored, goals conceded, and win‑loss record. Finally, the Dashboard sheet uses pivot tables and charts to display league tables, top scorers, and progression paths at a glance.
The template solves the common headache of juggling multiple web sources, manual calculations, and fragmented notes. By centralising all data, you can instantly see which teams are leading their groups, how the knockout brackets are shaping up, and which players are delivering the most goals. This saves hours of data entry and eliminates errors, letting you focus on analysis, discussion, or betting decisions rather than spreadsheet gymnastics.
It is ideal for football fans, sports journalists, bloggers, fantasy‑league participants, and even small‑scale sports analysts who need a reliable, up‑to‑date record of the tournament. Whether you are preparing a weekly blog post, creating a social‑media infographic, or simply tracking your favorite club’s journey, this workbook provides the structure and visual output you need.
How to use
- Open the workbook and go to the Group Stage sheet. Enter each match’s date, venue, home team, away team, and final score; the sheet will auto‑populate points and group rankings.
- Switch to the Knock‑out Rounds sheet after the group phase. Fill in the first‑leg and second‑leg scores; the template will calculate aggregate results and highlight the advancing side.
- Update the Team Overview sheet with any additional stats such as yellow cards or injuries; the dashboard will refresh automatically.
- Review the Dashboard sheet to see updated tables, charts, and a visual bracket that reflects the latest data.
Expected benefits include a streamlined workflow, reduced manual calculations, and a professional‑looking summary that can be shared instantly with friends, readers, or teammates.