

32‑by‑12 Epidemiological Health Survey Table Template
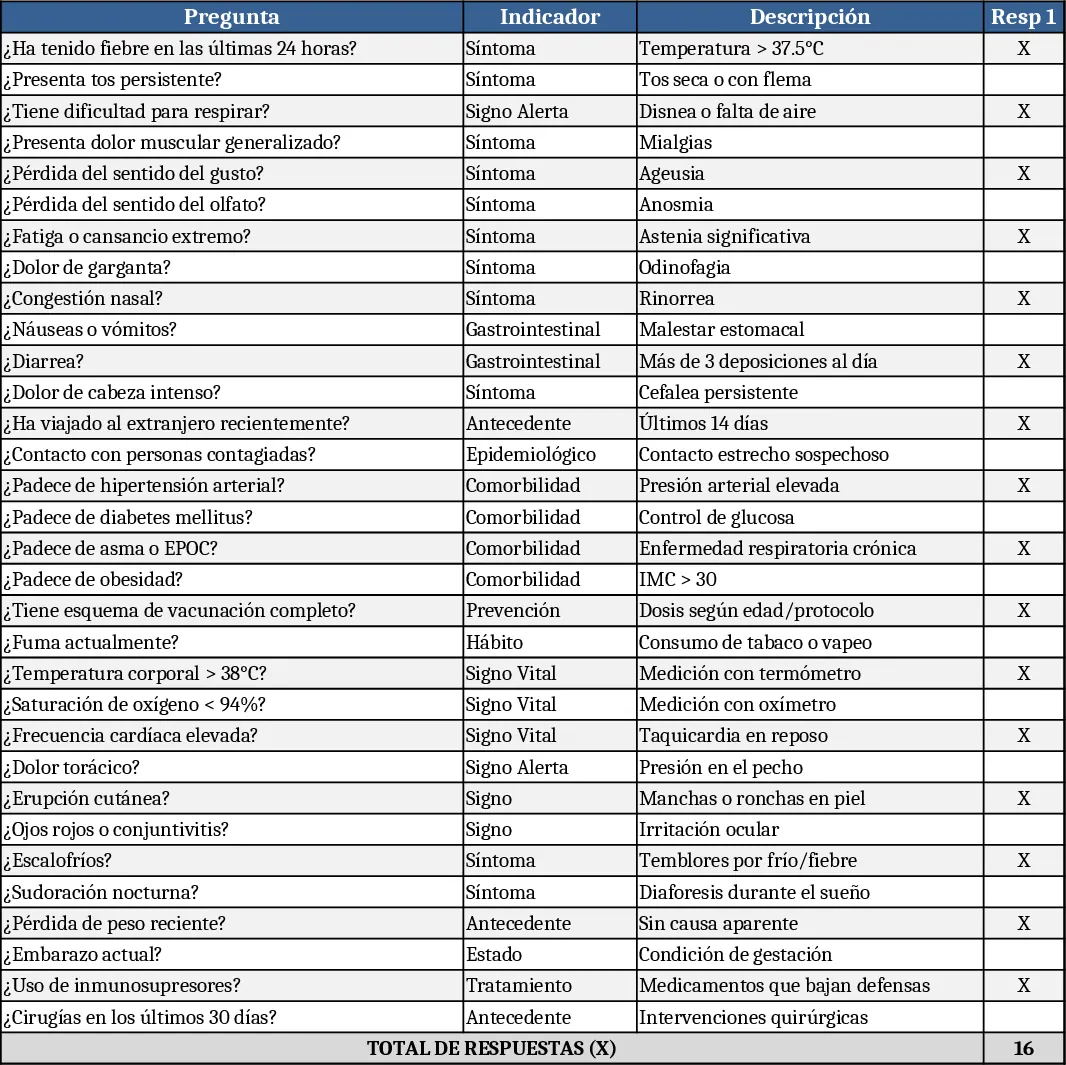
This Excel template gives you a ready‑made, printable sheet that fits an A4 page and measures exactly 32 rows by 12 columns. The first three columns are reserved for static identifiers such as Respondent ID, Age and Gender, while the remaining nine columns are blank cells where you can place a simple tick, X or check‑mark to record answers. Column widths and row heights are pre‑adjusted so the whole grid stays on one page, and the layout follows a classic epidemiological questionnaire style, making it easy to hand out, fill in, and later scan or digitise.
The template solves the common headache of designing a clean, uniform health survey from scratch. By providing a fixed structure, it eliminates the time spent aligning cells, setting print areas, and testing page breaks. You can focus on the content of your questions rather than the mechanics of the layout. It is especially useful for field teams, community health workers, or research assistants who need a quick, reliable way to capture symptom prevalence, risk‑factor exposure, or vaccination status across many participants while keeping the data collection sheet compact and easy to file.
Anyone who conducts routine health monitoring—public‑health officers, epidemiologists, clinic administrators, NGOs, or academic researchers—will find this template a practical starting point. It works well for cross‑sectional surveys, outbreak investigations, or routine health‑check questionnaires where the response options are binary (yes/no) or need a simple mark. Because the sheet is already sized to print on a single page, you can produce dozens of copies in minutes, distribute them in the field, and later import the marked data into a master spreadsheet for analysis.
The template helps you track basic demographic information together with a series of health‑related variables. By keeping the response cells blank, you can decide whether to use a tick, an X, or a colour‑fill, depending on your preferred data‑entry method. Once the sheets are filled, you can copy the raw rows into a master data sheet, apply filters, or use simple pivot tables to summarise prevalence rates, age‑group distributions, or gender‑specific trends. The clear separation of identifiers and answer cells also reduces transcription errors when you later digitise the information.
How to use
- Download the file and open it in Excel; the first sheet is the printable survey grid. Adjust the printer settings to "Fit Sheet on One Page" if needed.
- Edit the header row of the first three columns to match the identifiers you need (e.g., Participant ID, Age, Sex). You can also rename the remaining columns to reflect the specific health questions you are asking.
- Print the required number of copies, hand them out, and ask respondents or interviewers to place a tick or X in the appropriate cells for each question.
- After collection, scan or manually enter the marked cells into the accompanying "Data Entry" sheet; the template includes simple formulas that automatically count marked responses per question, giving you an instant snapshot of key metrics.
Expected benefits: you save hours of layout work, avoid printing errors, and get a tidy, ready‑to‑analyse data set with minimal manual cleanup.
Similar Templates Recommendation
Secondary School Results and Ranking Template
Track up to 200 secondary students' marks, auto‑calculate grades, averages, divisions and rankings in a clear, formatted sheet.

Couple Budget and Cash Flow Tracker Template
Track monthly income, expenses, and cash flow for a working couple, visualize budgets and savings goals in one spreadsheet.

Date Range and Internal Log Template
Create an Excel file with two columns for dates and internal notes, with colored rows for different date ranges.
