Executive Profit and Loss Statement Template
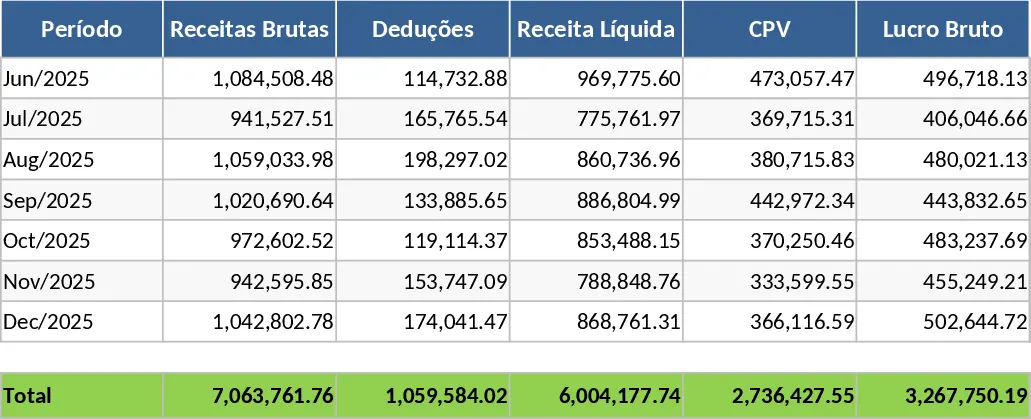
This executive-level P&L (DRE) template provides a comprehensive and high-level overview of your company's financial performance, specifically tailored for CEOs, business owners, and senior stakeholders. The template is organized into intuitive sections that cover the entire lifecycle of your business's income and expenditure. You will find dedicated sheets for data entry, monthly breakdowns, and a consolidated annual view. Key fields include gross sales, returns, taxes on sales, cost of goods sold (COGS), and a detailed breakdown of operating expenses such as payroll, marketing, and administrative costs. The template also features automated calculations for critical financial indicators like Gross Profit, EBITDA (Earnings Before Interest, Taxes, Depreciation, and Amortization), and Net Income.
The structure of the template is designed to be both robust and flexible. The main data entry areas utilize dropdown menus for categorization, ensuring that your data remains consistent and error-free across different periods. The monthly analysis section provides a side-by-side comparison of each month, making it easy to see growth patterns or areas where the business might be underperforming. Furthermore, the executive summary sheet distills all this information into a one-page report featuring key charts, such as revenue vs. expenses and profit margin trends. This allows a leader to get the big picture in seconds without getting bogged down in every single transaction.
For any leader, the primary challenge is often moving from raw data to actionable insights. This template solves that problem by transforming complex accounting entries into a clean, professional report. In your daily workflow, this means no more digging through various bank statements or messy spreadsheets to find your current margin. Instead, you have a centralized source of truth that highlights your profitability at a glance. It is particularly useful for identifying seasonal trends, spotting sudden spikes in operational costs, and ensuring that your business remains sustainable in the long run. This tool is ideal for CEOs of small to medium enterprises, financial controllers, and startup founders who need to present financial health to investors or board members.
How to use this template:
- Start by customizing the expense categories in the settings or input sheet to match your specific industry and internal accounting structure.
- Input your monthly revenue and cost data into the designated cells; the template will automatically update the subtotals and margins.
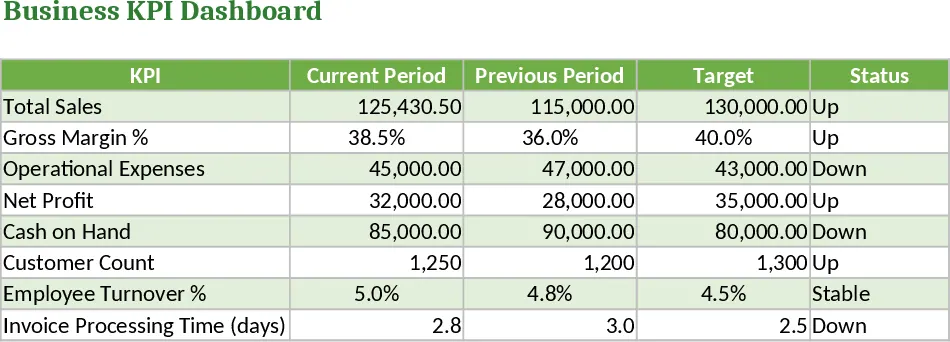
- Navigate to the Executive Dashboard or Summary sheet to view the visual charts and high-level KPIs that summarize your fiscal year performance.
- Use the comparison features to see how your actual results stack up against your initial budget or previous year's performance.
By implementing this structured approach to financial tracking, you can significantly reduce the effort required to prepare for executive meetings and gain much-needed peace of mind regarding your company's financial trajectory.
Similar Templates Recommendation
Income Statement Template
Track your business revenue, expenses, and net profit over time to gain a clear understanding of your financial performance and health.

Financial Results Summary Template
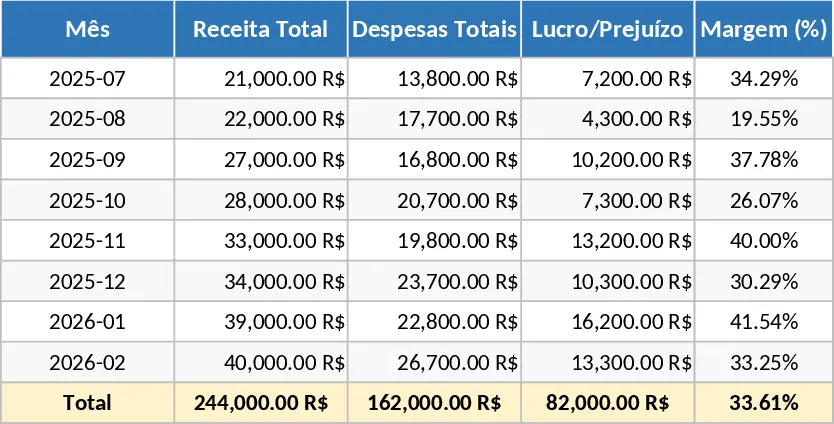
Monitor your company's financial health by tracking revenue, expenses, and profit margins through a clear and organized reporting dashboard.
Financial MIS, P&L, and Cash Flow Reporting Template
Track your company's financial health with integrated Profit and Loss statements, Cash Flow tracking, and comprehensive MIS reporting.