

Financial Results Summary Template
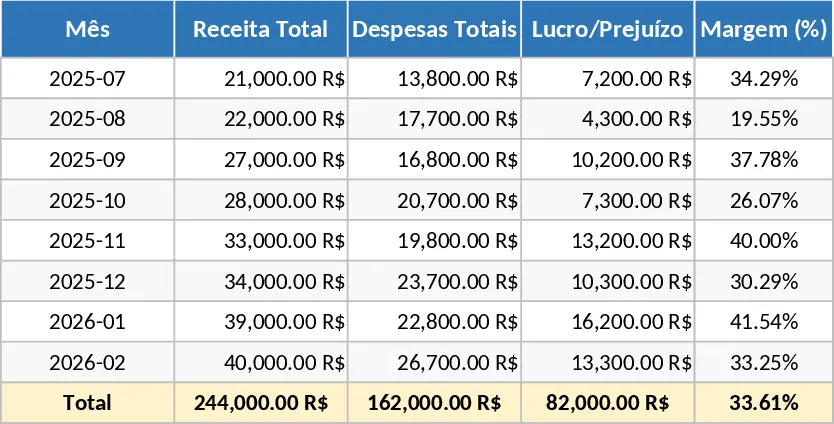
This Financial Results template provides a comprehensive and structured framework for businesses to consolidate their fiscal data into actionable insights. It features dedicated sections for recording monthly income, fixed and variable costs, and tax obligations. With built-in formulas and automated summary sheets, you can instantly visualize your net profit, gross margins, and year-over-year growth without the need for complex manual calculations. The template includes intuitive dropdown menus for expense categorization and clear input fields for various revenue streams, ensuring that your data remains organized and consistent throughout the fiscal year.
Managing a company's bottom line requires more than just keeping receipts; it requires a clear, high-level view of where money is being allocated and where it is being earned. This template solves the common problem of fragmented financial data by centralizing your Profit and Loss (P&L) statement into a single, easy-to-read file. It is particularly useful for small to medium business owners, freelance professionals, and department managers who need to present monthly or quarterly performance reviews to stakeholders or plan future budgets based on historical trends. By having all your financial metrics in one place, you can quickly identify which months were most profitable and which areas of the business are consuming the most resources.
The template helps you track essential key performance indicators such as operating expenses, diverse revenue streams, and net income. By maintaining a consistent record, you can identify seasonal trends, pinpoint areas of overspending, and ensure your business remains on a sustainable path. The clean, professional layout ensures that even those without an extensive accounting background can navigate the financial health of their organization with confidence. It serves as a bridge between raw transaction data and strategic business intelligence, making it an indispensable tool for daily financial oversight.
To get started with this template, follow these steps:
- Begin by entering your company information and setting up your specific revenue and expense categories in the configuration sheet.
- Input your actual monthly income and expense transactions into the ledger, ensuring you select the correct category for each entry to enable accurate reporting.
- Review the summary dashboard to see your automatically updated charts, profit margins, and financial ratios.
- Use the generated reports to compare your actual performance against your initial budget or previous year's data.
By implementing this structured approach to financial tracking, you can expect to significantly reduce the time spent on manual reporting and minimize the risk of calculation errors, leading to more informed and faster business decisions.
Similar Templates Recommendation
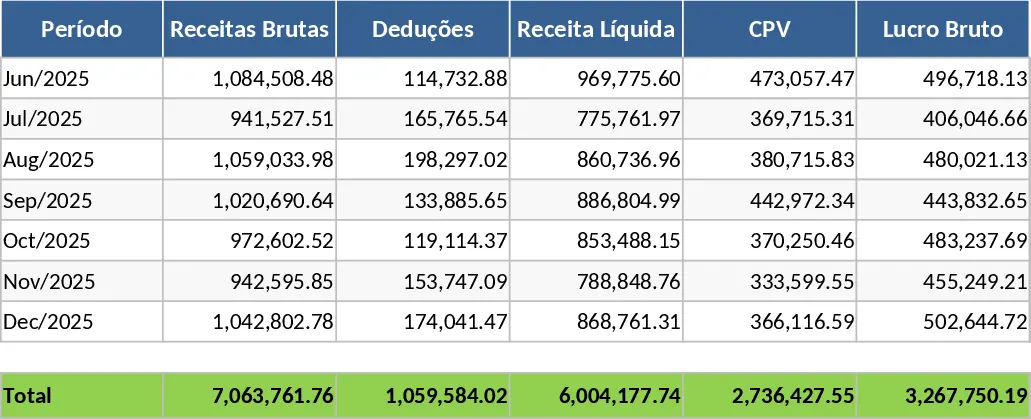
Executive Profit and Loss Statement Template
Monitor revenue, expenses, and net profit with a professional P&L statement designed for executive-level financial analysis and decision-making.
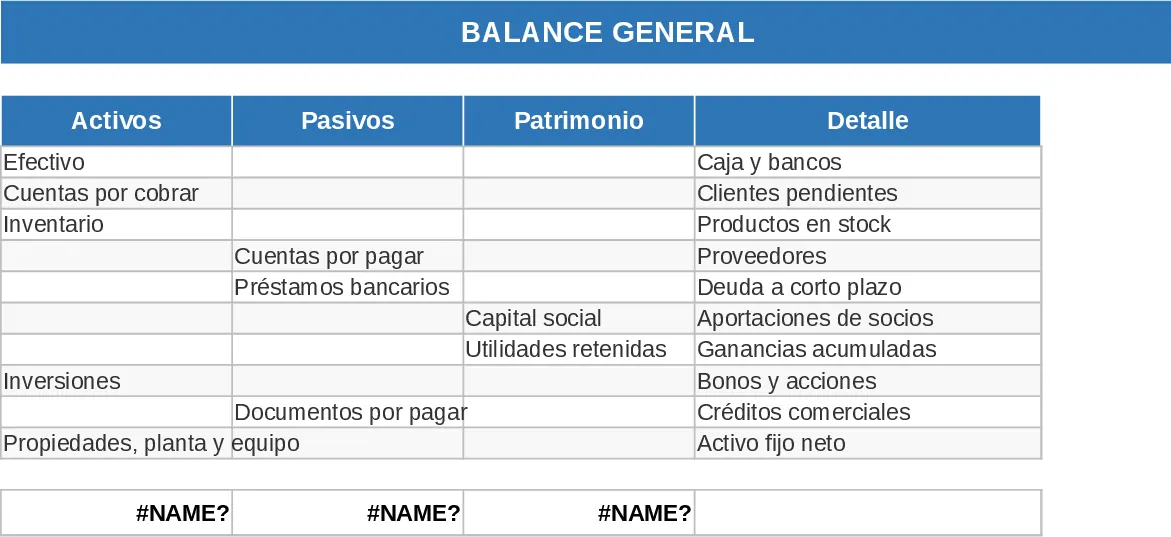
Comprehensive Financial Statements Package Template
Generate comprehensive financial reports including balance sheets, income statements, and cash flow to monitor your business health.
Income Statement Template
Track your business revenue, expenses, and net profit over time to gain a clear understanding of your financial performance and health.
