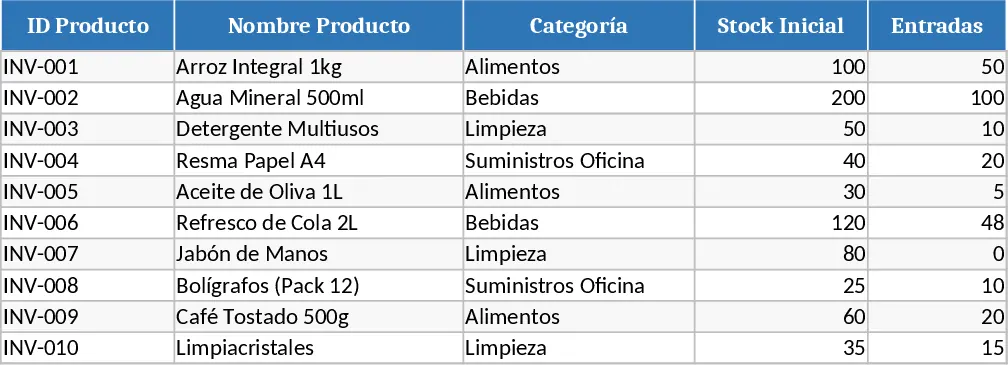
Sales & Inventory Dashboard with Purchase Planner Template
The Purchasing & Flow Dashboard is built on four linked sheets that turn raw transaction data into a clear visual overview of what you need to buy, which items move the most each month, and how stock flows in and out of your warehouse.
Structure
- Data Input – a table where you log every receipt and issue with columns for Date, Item Code, Description, Category (dropdown), Quantity In, Quantity Out, Unit Cost, and Supplier.
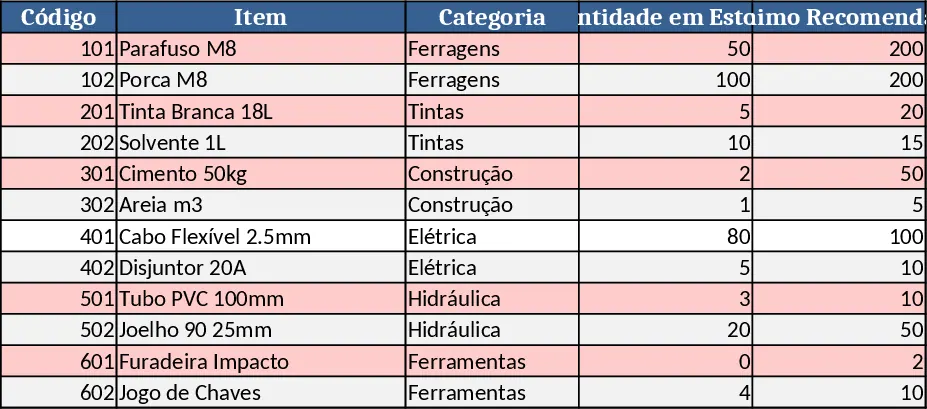
- Purchase Planner – a filtered view that flags items whose projected ending balance falls below a safety‑stock threshold you set per SKU. It automatically calculates recommended order quantities.
- Flow Summary – aggregates the Input data by month and by item, producing totals for Inbound, Outbound, Net Change, and Turnover Rate.
- Dashboard – a set of dynamic charts: a bar chart of the top 10 items by outbound volume, a line chart of monthly net flow, and a gauge showing overall stock health. A summary table highlights items to reorder, month‑over‑month growth, and cost impact.
Why it matters Managing purchasing and inventory manually leads to missed reorder points, excess stock, and unclear visibility into demand patterns. This template solves those pain points by instantly surfacing which products are depleting, which are driving the most movement, and how cash is tied up in stock. The visual cues let you make data‑driven buying decisions, reduce stock‑outs, and keep working capital lean.
Who benefits Ideal for procurement officers, inventory controllers, small‑to‑mid‑size operations managers, and anyone responsible for balancing supply with demand in a retail, manufacturing, or distribution setting. It works equally well for a single store or a multi‑location network when you add a Location column.
What you track
- Real‑time purchase recommendations based on safety‑stock levels.
- Monthly top‑moving items and their contribution to total outbound volume.
- Net inflow/outflow trends that reveal seasonal spikes or bottlenecks.
- Cost of goods sold per period, helping you gauge the financial impact of inventory decisions.
How to use
- Enter transactions – Fill the Data Input sheet with every receipt and issue; use the dropdowns for Category and Supplier to keep data consistent.
- Set thresholds – In the Purchase Planner sheet, define the safety‑stock quantity for each SKU; the sheet will auto‑highlight items below that level.
- Refresh the dashboard – Click any cell in the Dashboard sheet and press Ctrl + Alt + F9 (or use the Refresh button if you added one) to recalculate all formulas and update the charts.
- Review insights – Look at the bar chart for the month’s top outbound items and the gauge for overall stock health; adjust orders accordingly.
Expected benefits You’ll spend far less time hunting for low‑stock alerts, gain a quick visual pulse on product movement, and make purchasing decisions with confidence, freeing up time for strategic planning.