Real Estate Agency CRM Lead Heat Map Template
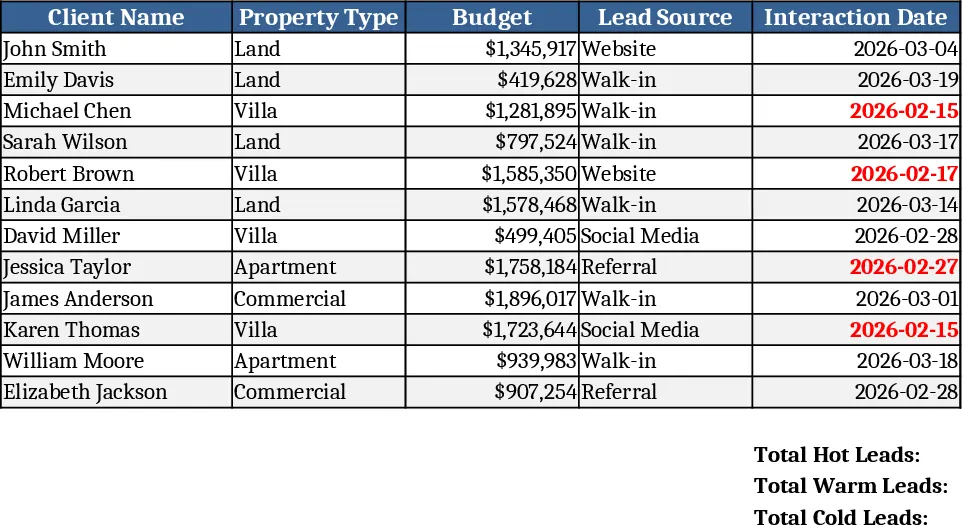
The Real Estate CRM template is organized into three simple sheets: Leads, Dashboard, and Settings. In the Leads sheet you’ll find columns for Client Name, Property Type, Budget, Lead Source, Last Interaction Date and a automatically‑generated Heat Map column. Property Type and Lead Source are set up as dropdown lists for consistency, while the Heat Map column uses a formula that compares the last interaction date against today and assigns a rank – Cold, Warm, Hot – which is highlighted with conditional‑format colors. The Dashboard sheet pulls key metrics from the Leads sheet, showing total leads, counts per heat‑map category, budget ranges, and a visual heat‑map chart that instantly highlights where your hottest prospects sit. Settings let you customize the date thresholds that define Cold, Warm and Hot, as well as add or edit property types and sources.
This template solves the common chaos of scattered lead information in real‑estate agencies. By consolidating every prospect into a single, sortable table and adding an instant visual cue of lead temperature, agents can prioritize follow‑ups, allocate marketing spend more wisely, and avoid missing opportunities that have gone cold. The heat‑map visualization turns raw dates into actionable insight, turning weeks‑old contacts into a clear "cold" label while flagging recent, engaged prospects as "hot". The result is a more disciplined pipeline, faster response times, and higher conversion rates without the need for separate CRM software.
Designed for real‑estate agents, brokers, and agency managers who handle multiple property inquiries daily, this template fits any scenario where leads need to be tracked, qualified, and acted upon. Whether you’re a solo agent juggling a handful of clients or a team lead overseeing dozens of prospects, the sheet scales to your volume and provides the same clear, color‑coded priority view. It’s especially useful during busy seasons when new inquiries flood in and quick triage is essential.
How to use
- Open the Leads sheet and enter each prospect’s details – name, property type, budget, source and the date of your last contact.
- Choose the appropriate option from the Property Type and Lead Source dropdowns; the Heat Map column will update automatically based on the interaction date.
- Switch to the Dashboard sheet to see a summary of total leads, counts per heat‑map category, and a heat‑map chart that highlights hot leads.
- Adjust the thresholds in Settings if you want to redefine what counts as Cold, Warm, or Hot for your business.
Expected benefits: a clearer view of priority leads, faster follow‑up decisions, and reduced time spent manually sorting and ranking prospects.
Similar Templates Recommendation
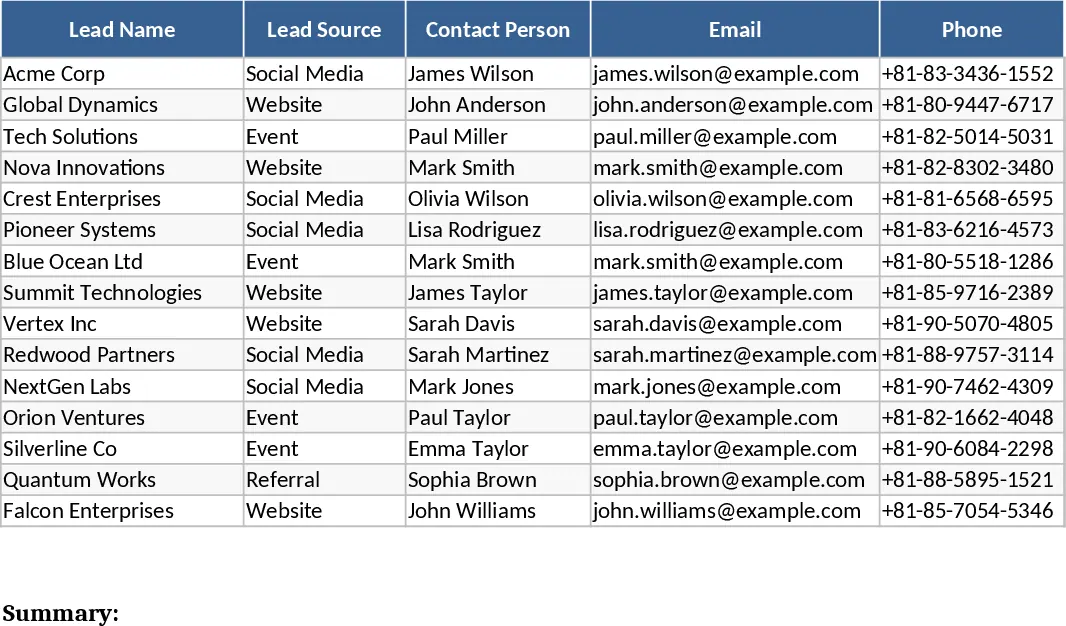
Sales Lead Tracker and Funnel Dashboard Template
Manage your sales pipeline, track lead sources, and visualize conversion rates with an automated dashboard and funnel chart.
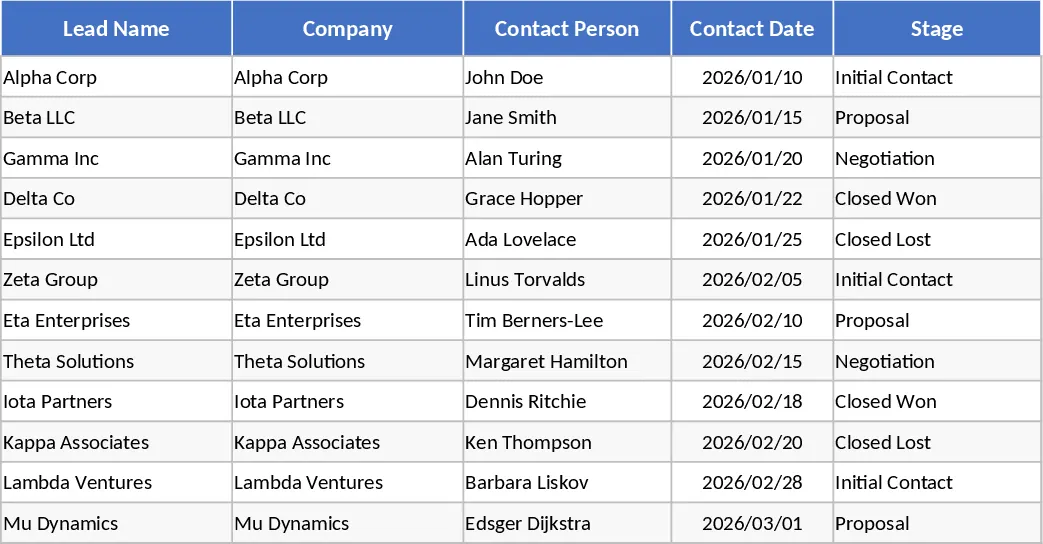
Automated Sales Win-Rate and Contact Tracker Template
Track your sales pipeline with automated win-rate calculations and monitor the last contact date to ensure no lead goes cold.
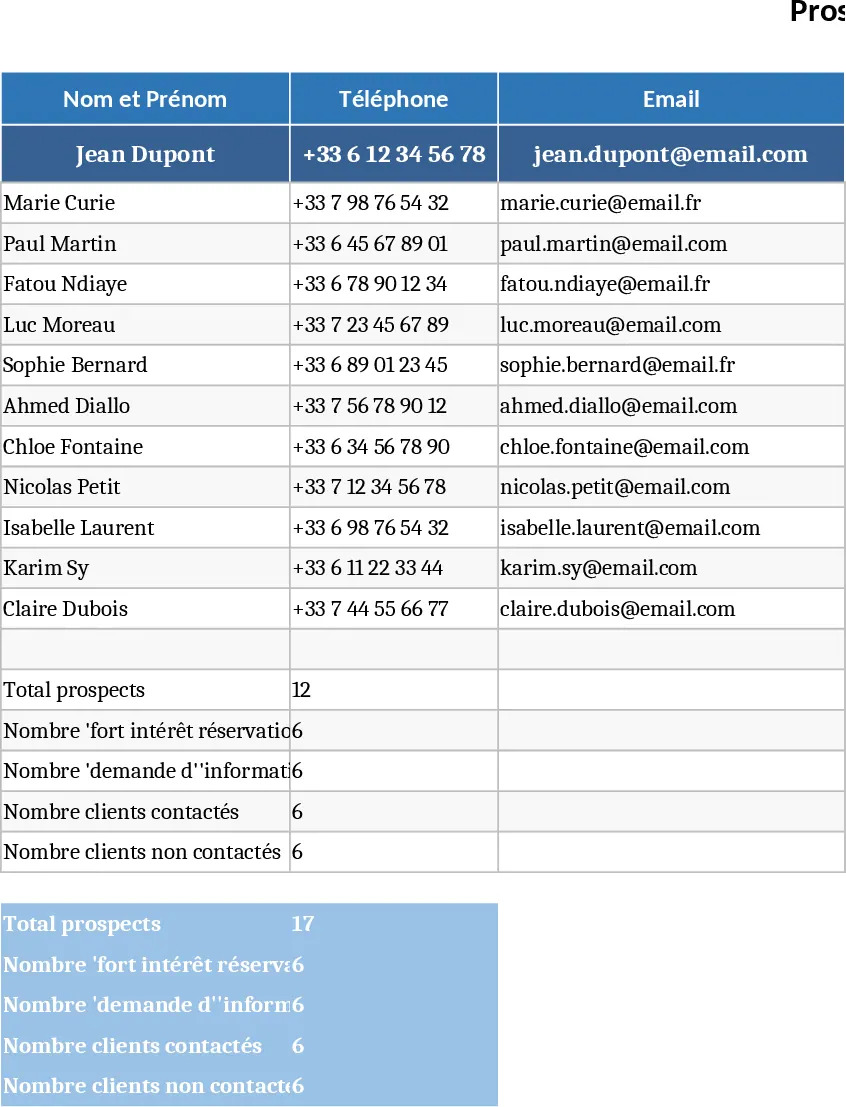
Atelier Loza Maleombho Real Estate Prospect and Client Tracking Template
Manage real estate leads and client follow-ups with contact details, interest status, and appointment scheduling for the Loza Maleombho project.