Multi-Product Break-Even Point Analysis and Management Dashboard Template
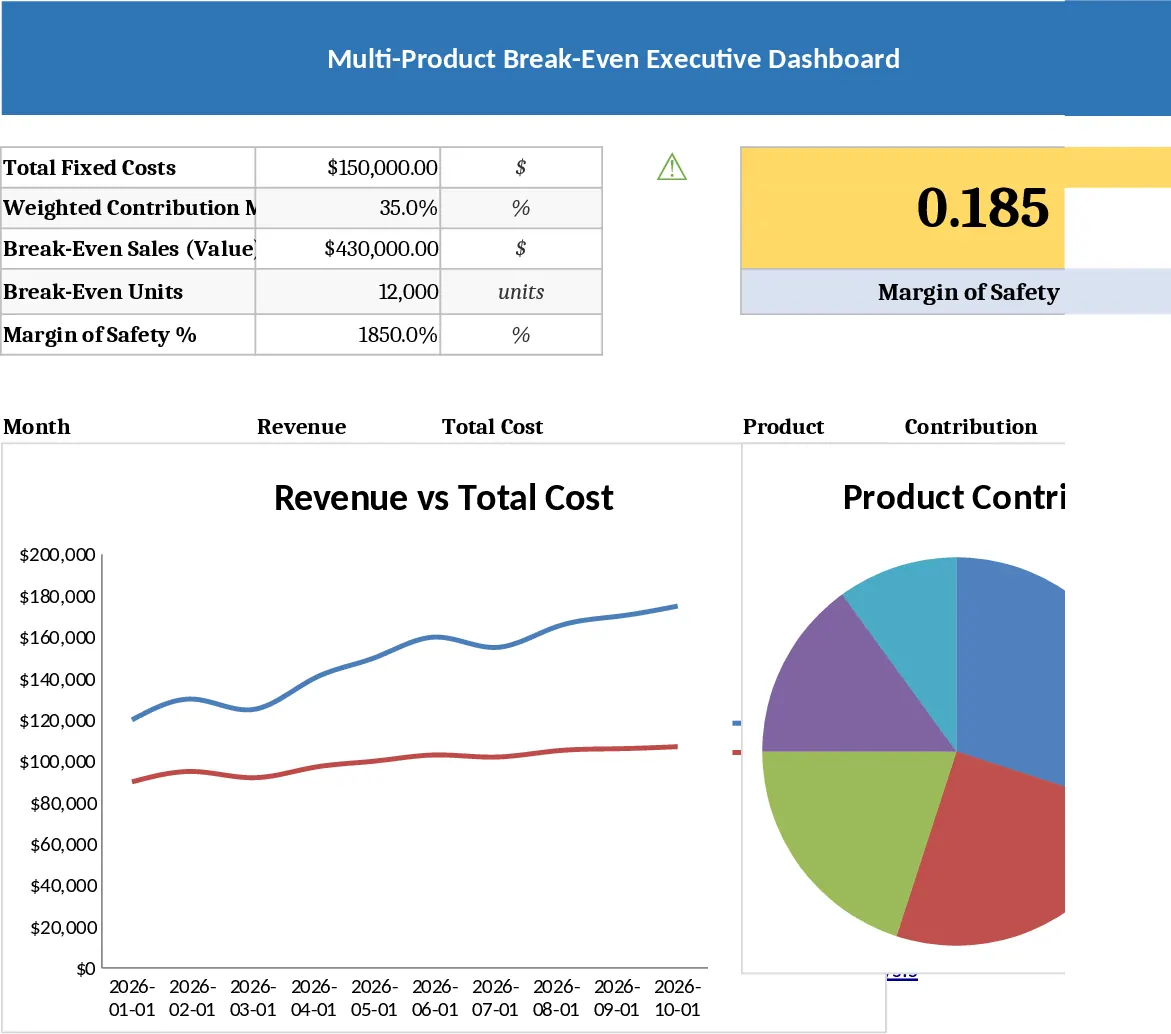
This Professional Multi-Product Break-Even Excel System is a comprehensive financial modeling tool designed specifically for small and medium-sized businesses managing diverse product portfolios. The workbook features five specialized sheets: a Home Dashboard for executive summaries, an Input Data sheet for product-specific variables, a robust Calculation Engine, a Scenario Analysis tool for risk assessment, and a printable Management Report. Users can input selling prices, variable costs, and sales mix percentages to automatically calculate weighted contribution margins and the exact break-even point in both currency and units. The system supports multi-language data entry, allowing for global business use while maintaining a professional English interface.
This template solves the challenge of calculating profitability when different products have varying margins and sales volumes. It provides immediate visibility into your Margin of Safety (MOS) with color-coded KPI cards, helping you identify if your business is in a high-risk zone. By automating the weighted average calculations, it eliminates manual errors and allows for rapid what-if testing. Whether you are planning a new product launch or adjusting your annual budget, this tool helps you determine exactly how much you need to sell to cover all costs and reach your target profit. The dynamic charts and visual indicators transform complex financial data into clear, actionable insights for any business owner or manager.
To get started, follow these steps:
- Navigate to the Input Data sheet and enter your total fixed costs along with your product list, including prices and variable costs. Ensure your Sales Mix percentages total 100% to accurately reflect your revenue distribution.
- Visit the Scenario Analysis sheet to adjust variables and see how a 10% change in costs or prices impacts your bottom line across base, optimistic, and worst-case scenarios.
- Use the Home Dashboard to monitor your Break-Even Chart and visual KPI cards, then head to the Management Report to extract actionable insights and decision recommendations for your next meeting.
Expected benefits: Significant reduction in financial modeling time and improved accuracy in profit forecasting and risk assessment.