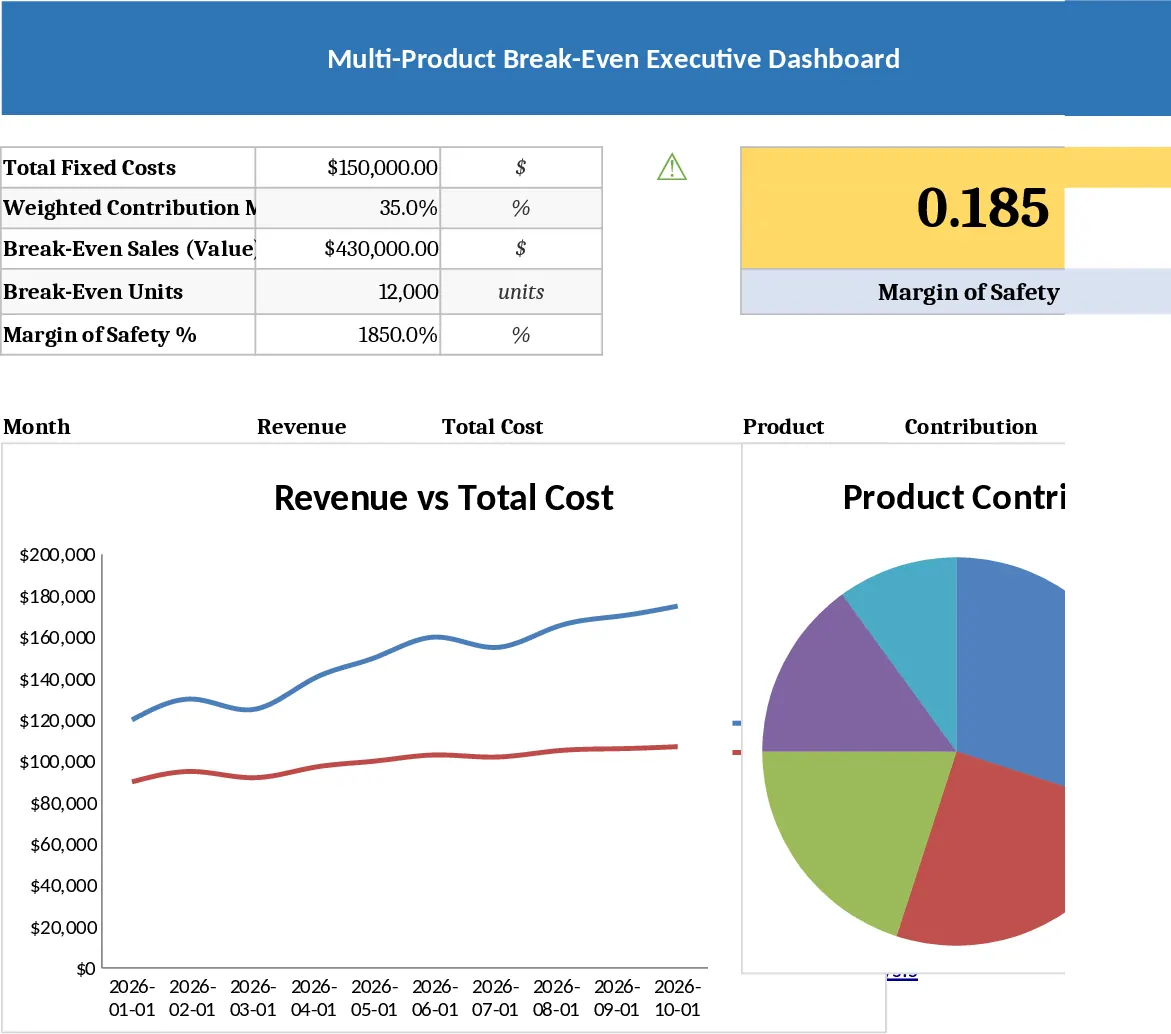
Financial Break-even Point Simulator and Scenario Analysis Template
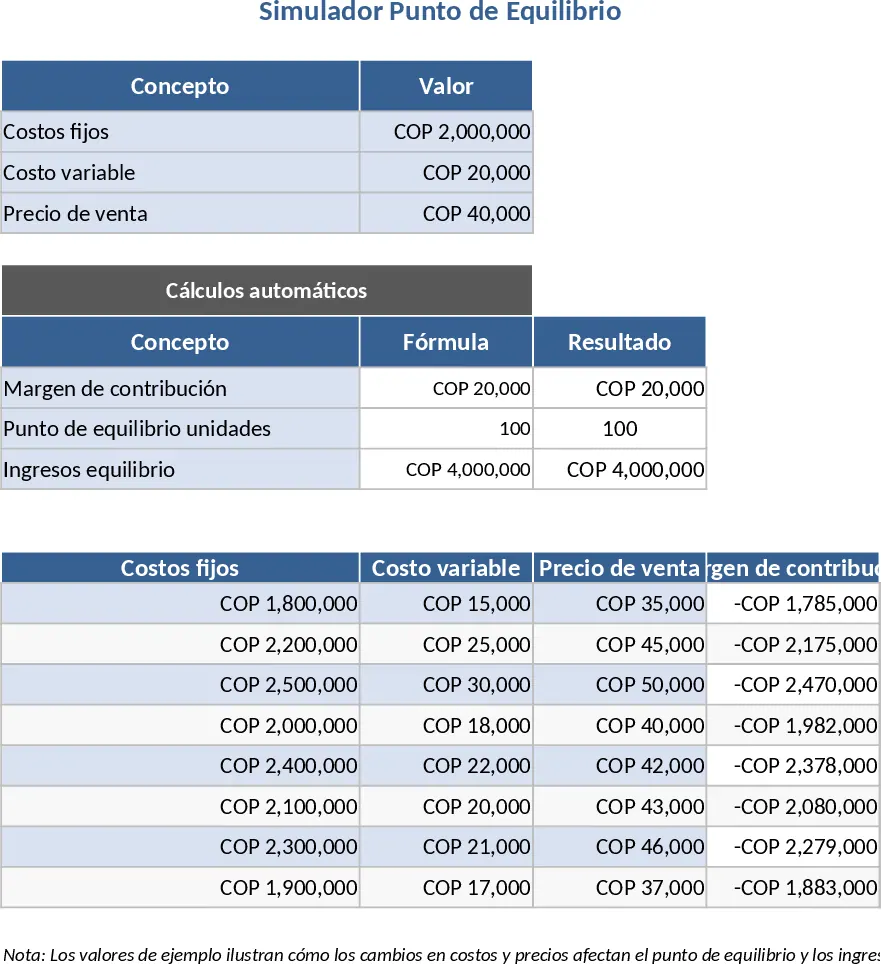
The Break-even Point Simulator is a fundamental financial tool designed to help you identify the exact moment your business stops losing money and starts generating profit. This template provides a structured environment where you can input your fixed costs, such as rent and salaries, and variable costs, like raw materials and packaging, alongside your intended selling price. The core of the template is a dynamic calculation engine that determines your contribution margin and the specific number of units required to cover all expenses, providing a clear target for your sales team.
This tool is essential for entrepreneurs, small business owners, and financial students who need to evaluate the feasibility of a project or a new product launch. Instead of guessing your targets, you get a data-driven number that informs your pricing and sales strategy. It helps you understand the delicate relationship between price and volume, allowing you to see how a small change in your selling price can drastically reduce the number of units you need to sell to stay afloat. It effectively solves the problem of financial uncertainty by providing a visual and mathematical roadmap to profitability.
The template is organized into three main sections for maximum clarity. The Data Entry zone is where you list all operational costs and pricing. The Calculation area automatically computes the break-even point in both units and total revenue. Finally, the Scenario Analysis section lets you compare optimistic, probable, and pessimistic outcomes by adjusting your price points. This is paired with a professional break-even chart that plots your total revenue against total costs, making it easy to present your findings to stakeholders or investors during a business pitch or internal review.
How to use:
- Fill in the Fixed Costs section with your monthly overhead like rent, utilities, and payroll, then enter your Variable Costs per unit.
- Input your intended Selling Price to automatically calculate your Margin of Contribution and the Break-even Point.
- Review the generated Break-even Chart to visualize the intersection where your business becomes profitable.
- Use the Scenario table to test different pricing strategies and see how they impact your required sales volume and total utility.
By using this simulator, you can significantly reduce the time spent on manual financial modeling and gain immediate clarity on your business's financial health. It provides a professional framework for risk assessment and helps you set realistic sales goals with minimal effort, ensuring you focus your energy on growth rather than complex arithmetic.
Similar Templates Recommendation
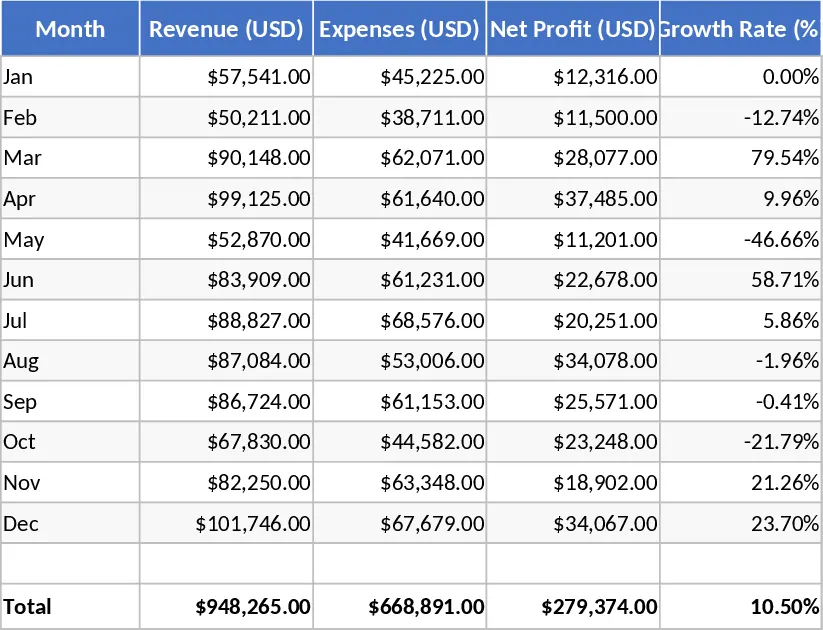
2026 Business Forecast Template
Plan your financial future with this comprehensive 2026 forecasting tool to track projected revenue, expenses, and cash flow trends.
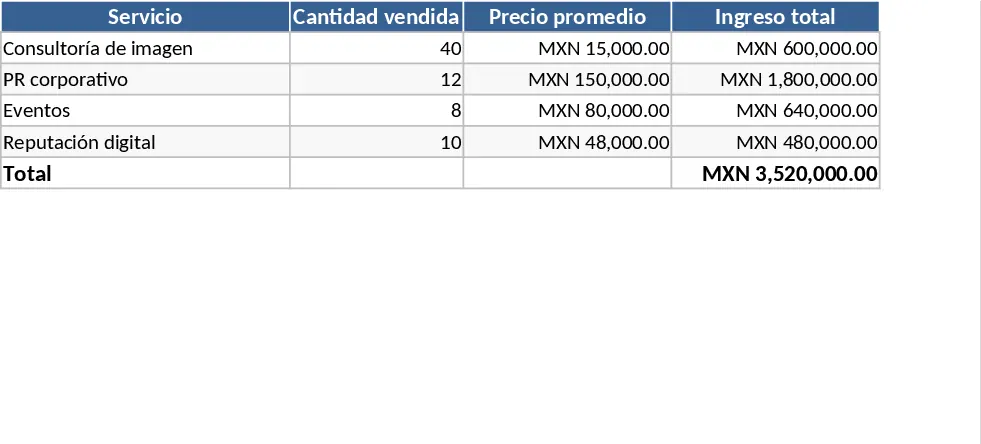
PR Agency Financial Viability and Sales Metrics Template
Track agency revenue, manage costs, and analyze financial viability with automated income statements, break-even metrics, and sales charts.
Multi-Product Break-Even Point Analysis and Management Dashboard Template
Track multi-product break-even points, contribution margins, and safety margins with a professional dashboard and scenario analysis tool.