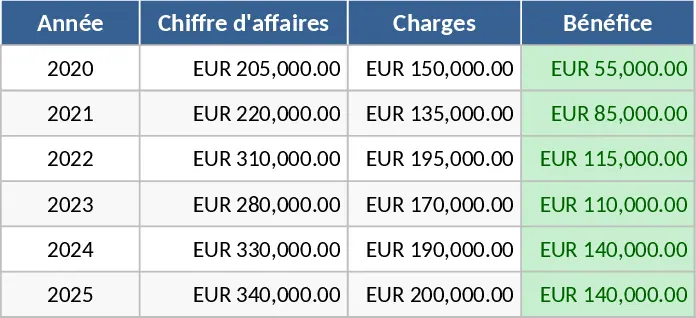
2026 Business Forecast Template
The Forecast 2026 template serves as a robust framework for strategic financial management, specifically tailored to help businesses navigate the complexities of the upcoming fiscal year. This template is meticulously organized into several key modules, including a revenue projection engine, an expense tracker, and a comprehensive cash flow analysis sheet. Within these sections, you will find intuitive fields for entering monthly data, along with customizable dropdown menus for categorizing different types of income and expenditures. The template is designed to handle various business models, allowing you to adjust growth rates and inflation assumptions to see how different scenarios might impact your overall profitability.
One of the primary benefits of using this forecasting tool is the ability to bridge the gap between high-level goals and daily operational realities. It solves the common problem of budget drift by providing a clear, month-by-month roadmap that you can refer back to throughout the year. By documenting your assumptions and targets in one place, you create a single source of truth for your financial health. This level of organization is vital for identifying potential cash shortages before they happen, enabling you to adjust your spending or ramp up sales efforts proactively. The dashboard section is a standout feature, offering a suite of interactive charts and graphs that visualize your financial trajectory. You can track metrics such as Gross Margin, Operating Margin, and Net Profit over time, ensuring you stay informed about your business's efficiency.
This template is an ideal companion for small to medium-sized enterprise owners, financial controllers, and project managers who are responsible for departmental budgets. It is particularly effective during the annual planning season or when preparing for a significant business pivot. By providing a structured environment for data entry, it ensures that no critical expense is overlooked and that revenue expectations remain grounded in reality. The automated summary outputs, including profit and loss visualizations and break-even analyses, provide the high-level insights necessary for executive reporting and strategic reviews. Furthermore, the template facilitates better communication across your organization; when every department uses the same forecasting logic, it becomes much easier to consolidate figures for a company-wide view.
How to use this template:
- Begin by entering your baseline data in the Configuration tab, including your starting cash balance and specific revenue categories tailored to your industry.
- Populate the monthly projection sheets with your anticipated sales volumes and fixed costs like rent, salaries, and software subscriptions.
- Use the Scenario Analysis feature to test different growth percentages, seeing how a 5% or 10% change in revenue affects your year-end totals.
- Regularly update the Actuals column as the year progresses to see real-time variance reports and adjust your strategy accordingly.
By centralizing your financial planning within this template, you can expect to significantly reduce the effort required for manual data consolidation and reporting. It provides a professional, ready-to-use structure that empowers you to focus on growth rather than spreadsheet maintenance.
Similar Templates Recommendation
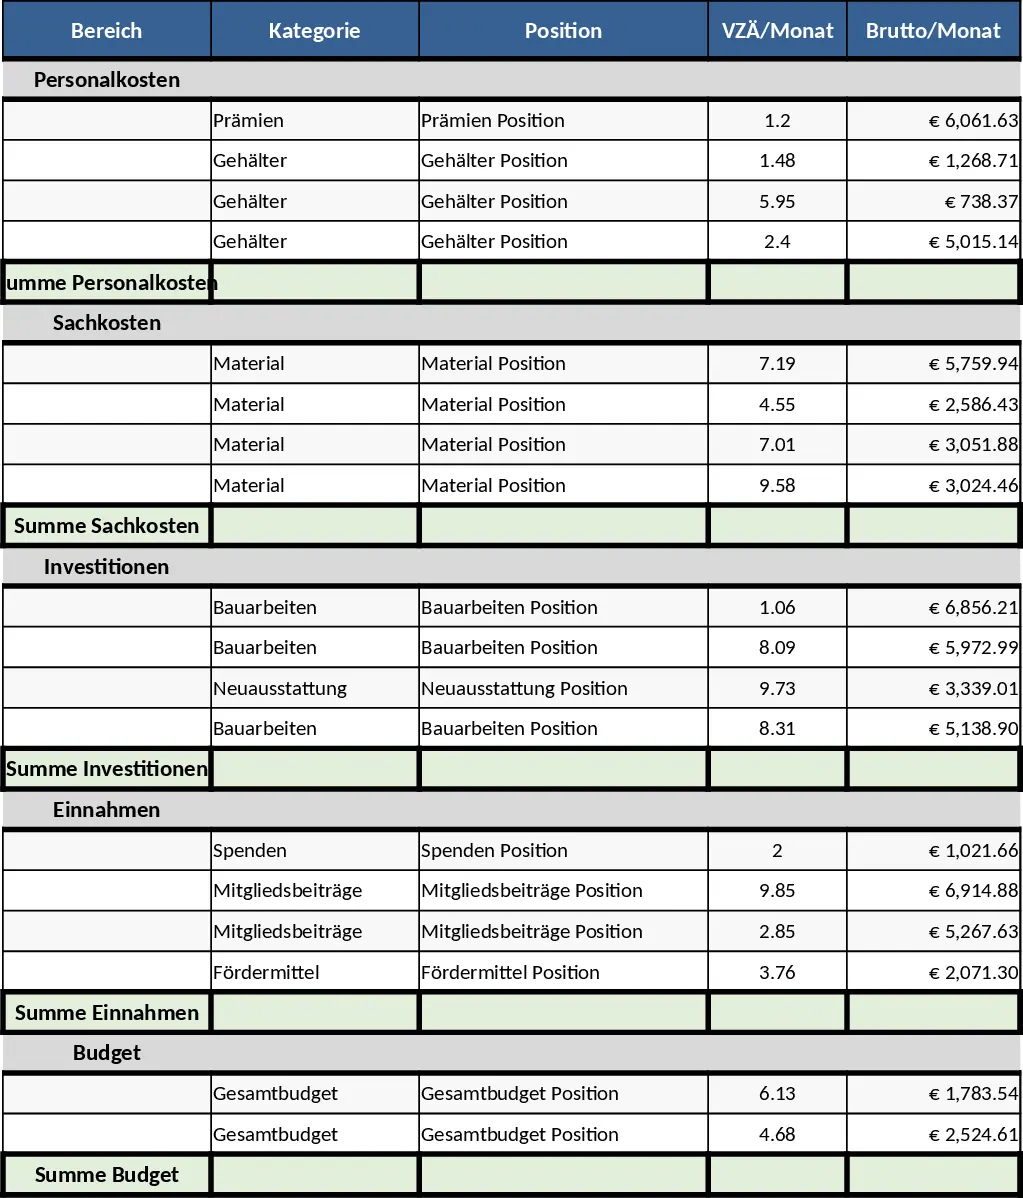
Educational Institution Financial Planning and Scenario Template
Track personnel costs, operating expenses, and income with scenario analysis and traffic light visuals to monitor your financial performance.
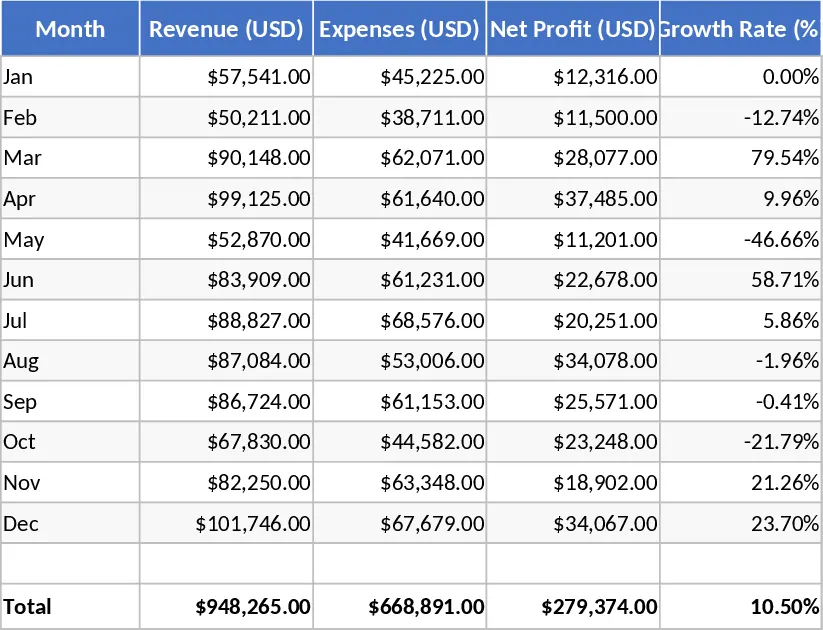
Annual Business Profit Calculator Template
Track your company's annual revenue and expenses to automatically calculate net profit and monitor financial health throughout the year.
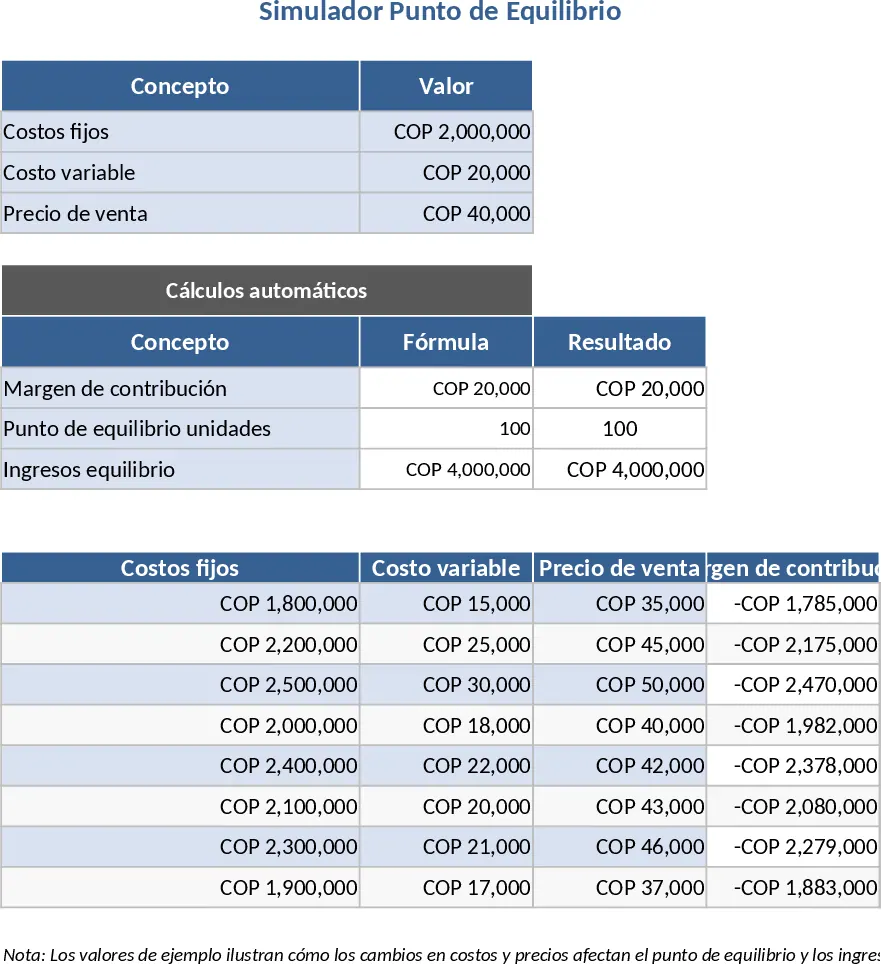
Financial Break-even Point Simulator and Scenario Analysis Template
Calculate your break-even point by entering fixed and variable costs to visualize profitability through automated charts and scenarios.