Product Management & Weekly Financial Tracker Template
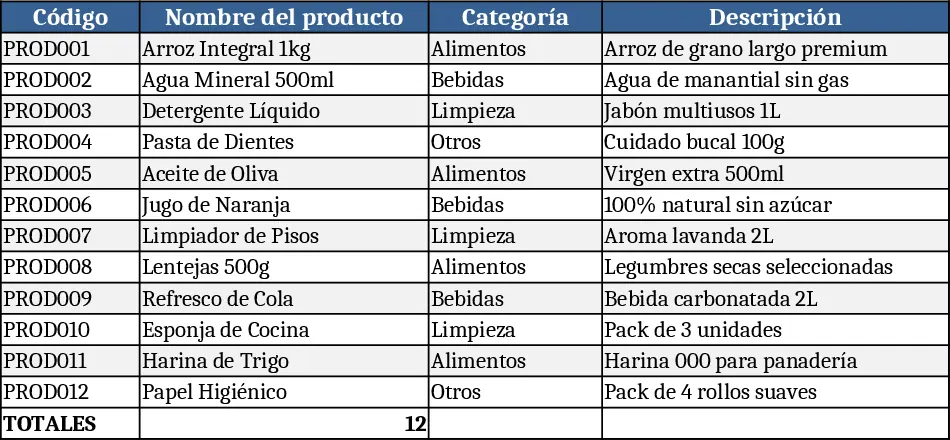
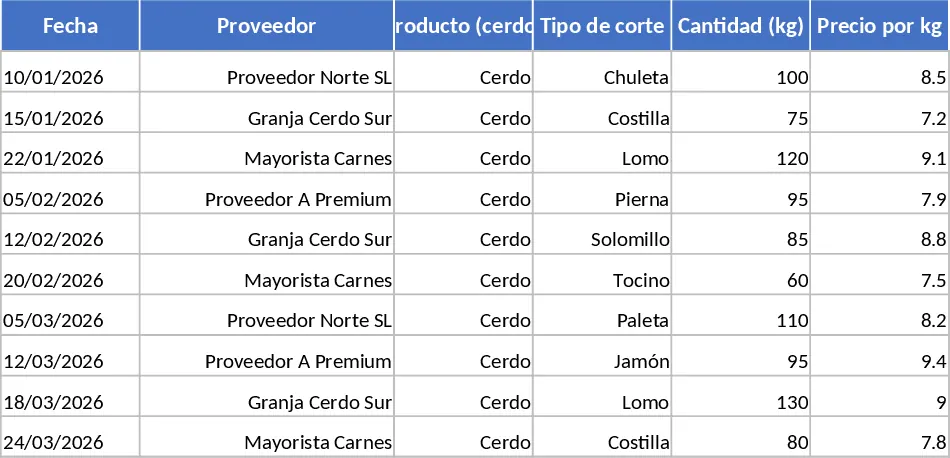
This template is a compact 4‑sheet workbook designed for small retailers, online sellers, or any business that needs a clear view of product flow and financial results. Sheet 1 – Product Register – holds a table for SKU, name, category, unit price, stock level and a column where you can paste a product photo. Sheet 2 – Weekly Purchases – is pre‑formatted for four weeks of a month, with dropdowns for product selection, quantity bought, supplier, and cost per unit. Sheet 3 – Weekly Sales – mirrors the purchase sheet, letting you log weekly sales by product, quantity sold, price, and customer segment. Sheet 4 – Result Dashboard – pulls data from the first three sheets to calculate total purchases, total sales, gross profit, and net profit, and it displays simple bar charts for inventory turnover and revenue trends.
The workbook solves the common headache of juggling separate files for stock, buying, and selling. By consolidating everything, you instantly see which items are moving fast, which are over‑stocked, and how weekly buying decisions affect your bottom line. The visual summary helps you spot trends without manual calculations, making budgeting and re‑ordering decisions faster and more reliable. It’s especially useful for owners who need to keep a tight grip on cash flow while still offering a diverse product range.
Anyone who manages inventory – shop owners, market stall operators, e‑commerce managers, or sales team leaders – will find this template valuable. It works best when you need a month‑by‑month snapshot of product performance, want to compare purchase versus sales volumes, and require a quick profit‑and‑loss overview without complex accounting software.
How to use
- Open the Product Register sheet and fill in each product’s details; use the image cell to paste a photo (copy‑paste or insert → Picture).
- In the Weekly Purchases sheet, select the product from the dropdown, enter the quantity bought each week, supplier name, and unit cost; the sheet auto‑calculates weekly purchase totals.
- Switch to the Weekly Sales sheet, repeat the process for sales, choosing the product, entering quantity sold, price, and customer type; totals are computed automatically.
- Go to the Result Dashboard – the key metrics and charts update instantly, showing total purchases, sales, gross profit, net profit, and visual trends.
Expected benefits: streamlined data entry, reduced manual calculations, clearer insight into inventory health, and faster monthly profit reporting, saving you hours of spreadsheet juggling each cycle.