Pork Cuts Trading Management Dashboard Template
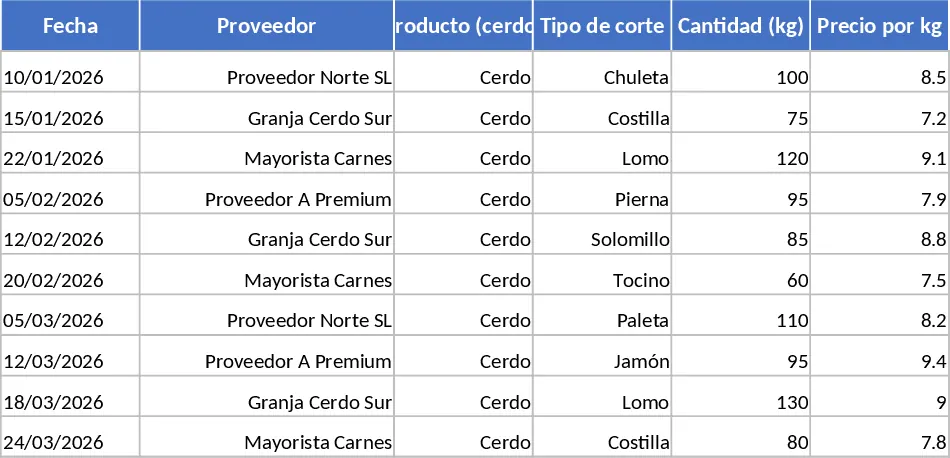
This Excel solution is built around six interconnected sheets that cover every aspect of a pork‑cut trading business. The Purchases sheet records each acquisition with date, supplier, cut type, kilograms, price per kilogram and automatically calculates the total cost. The Sales sheet mirrors this layout for outgoing transactions, linking to a drop‑down list of customers and cut types to keep data consistent. The Inventory sheet pulls the purchase and sales totals to compute current stock for each cut, using a simple formula that updates in real time. A Clients sheet stores contact details and serves as the source for the sales drop‑down, while the Products (Cuts) sheet holds all cut names, allowing you to add new varieties that instantly become available in the other sheets. Finally, the Dashboard brings everything together with pivot tables, slicers for date, client and cut, and a set of charts that show monthly, quarterly, semi‑annual and yearly revenue, purchase expenses, profit margins, top‑spending clients and best‑selling cuts.
The workbook solves the common headache of juggling separate spreadsheets or manual calculations. By automating totals, stock balances, and visual summaries, it eliminates double‑entry errors and gives you instant insight into cash flow and profitability. Small business owners, butchers, and market vendors can see at a glance which cuts move fastest, which customers generate the most revenue, and how their buying decisions affect margins. The clean, professional layout makes it ready for daily use without any extra formatting work.
What you can track and manage includes: purchase costs per kilogram, sales revenue per cut, real‑time inventory levels, client activity, and overall financial performance across multiple time frames. The dynamic dashboard updates automatically as you add new rows, so you always have an up‑to‑date picture of your business health.
- Enter each purchase in the Purchases sheet, selecting the supplier and cut from the provided lists; the total cost fills in automatically.
- Log every sale in the Sales sheet, choosing the client and cut type; the sheet calculates the sale total and feeds the inventory sheet.
- Review current stock in the Inventory sheet, which aggregates purchases and sales to show remaining kilograms for each cut.
- Use the slicers on the Dashboard to filter charts by date range, client or cut, and watch the revenue, expense and profit graphs adjust instantly.
Expected benefits include faster month‑end reporting, reduced manual calculations, and clearer decision‑making thanks to visual performance indicators.
Similar Templates Recommendation
Workbook Design Guide Template
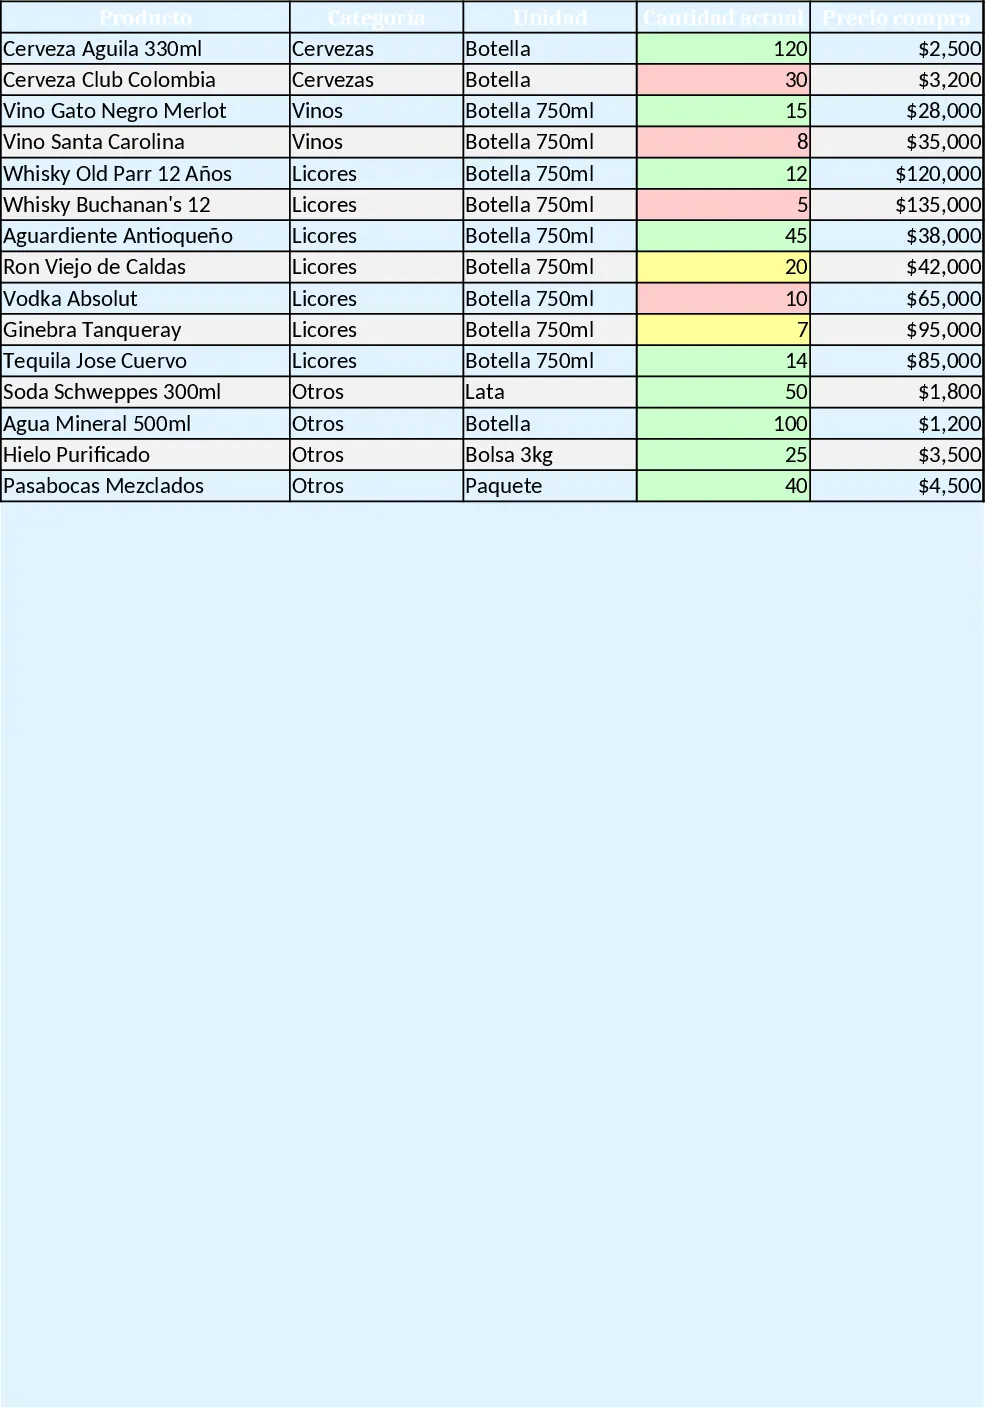
A ready‑to‑use Excel workbook that tracks inventory, purchases, sales, daily cash flow and visual dashboards for a small liquor bar.
Vehicle Spare Parts Brokerage and Inventory Management Template
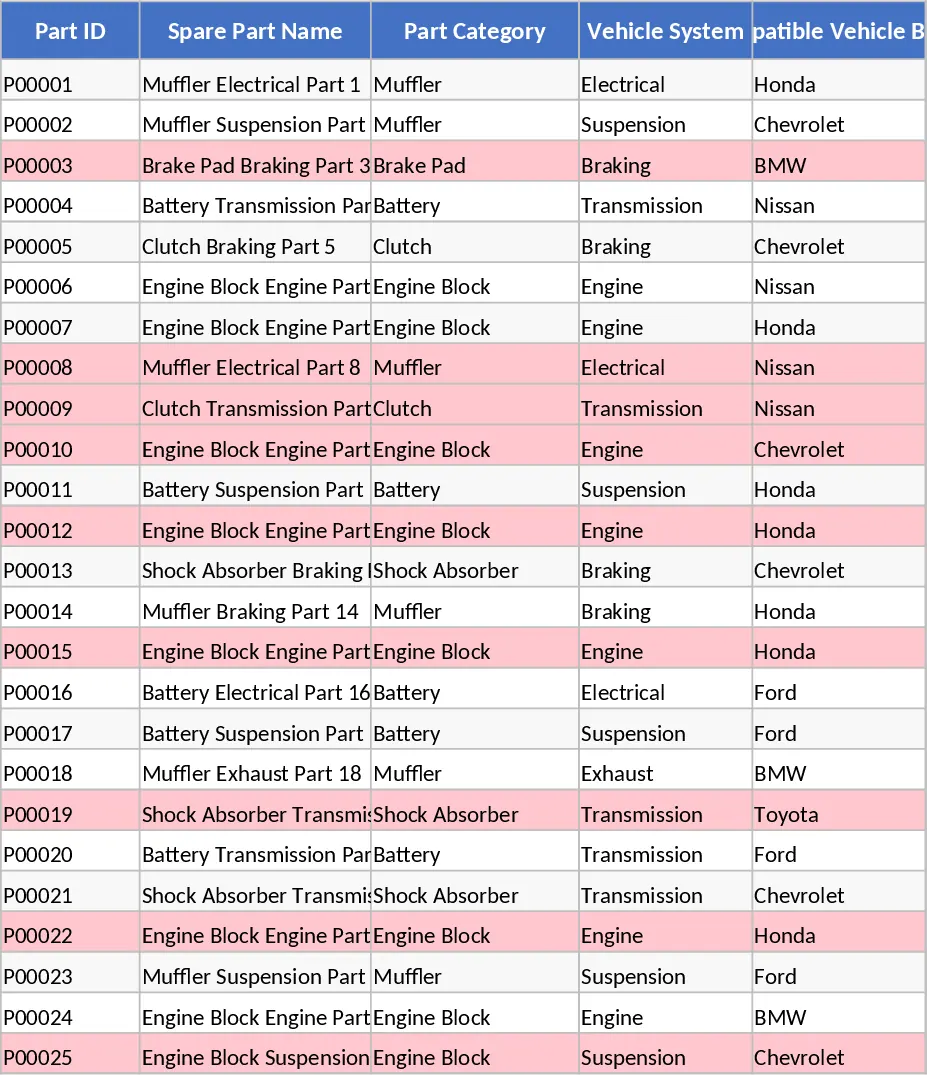
Track vehicle spare parts inventory, manage buyer requests, and monitor brokerage profits with this automated multi-sheet management system.
Mercado Libre Sales Performance Dashboard Template
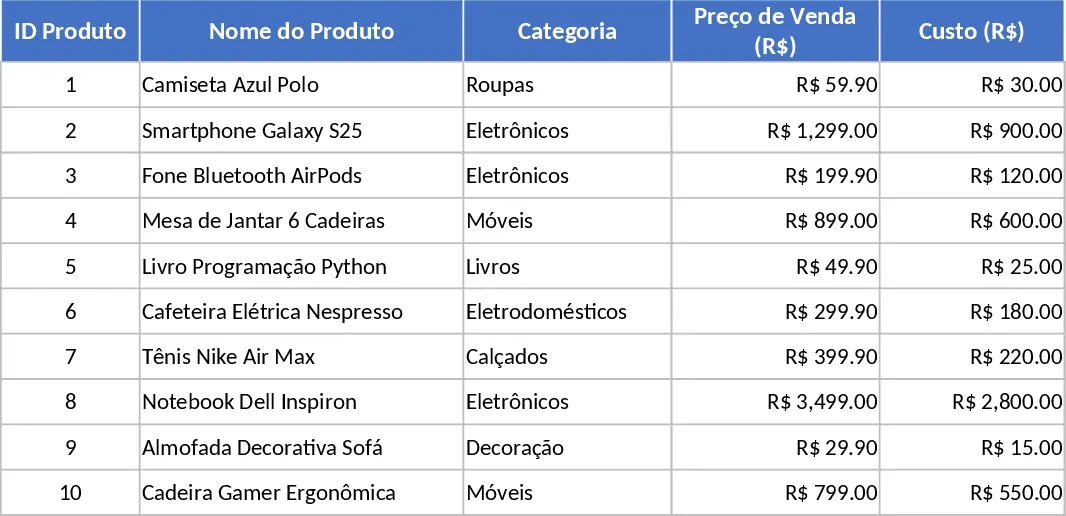
Track and analyze your Mercado Livre product sales, costs, profits and daily performance with automated tables, charts and a dashboard.