Mercado Libre Sales Performance Dashboard Template
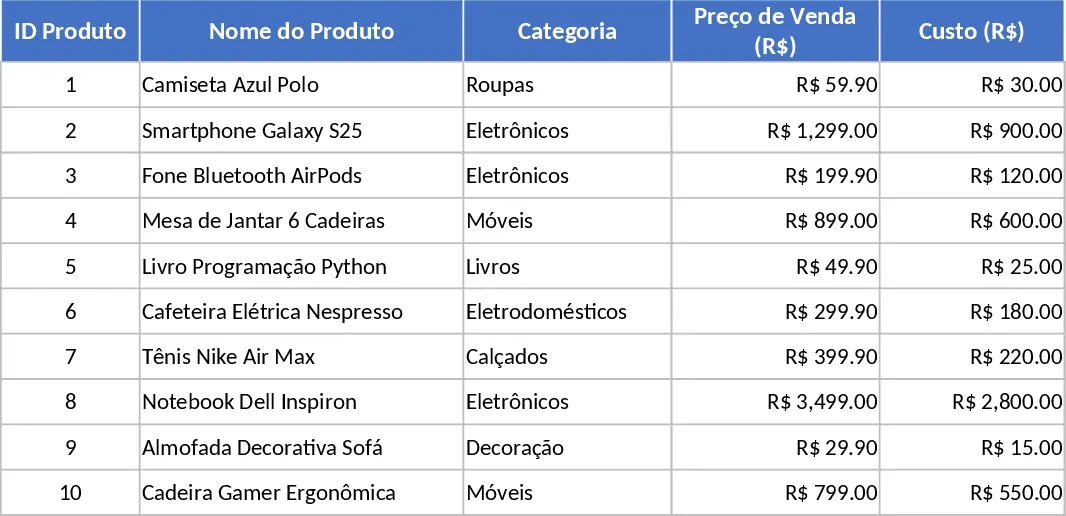
The template is built around four interconnected sheets – Produtos, Vendas, Resumo and Dashboard – each designed as an Excel Table (Ctrl+T) for instant sorting, filtering and expansion. In the Produtos sheet you register every item with its ID, name, category, selling price and purchase cost. The unit profit column is calculated on the fly (Preço – Custo) and formatted in Brazilian Real. The header row is highlighted with a dark background and white font for quick visual reference.
The Vendas sheet captures each transaction: date, product ID (chosen from a dropdown linked to the Produtos list), product name, quantity sold, unit price and automatically derived totals. Formulas pull the cost per unit from the Produtos sheet using XLOOKUP, then compute total revenue, total cost and profit for every line. All dates are properly formatted and the table includes filters for fast period analysis.
The Resumo sheet aggregates the raw data with SUMIFS functions. It shows, per product, total units sold, total revenue, total profit, sales today, this week and this month, plus the average profit per unit. Conditional formatting highlights the highest‑earning items in green and the lowest in red, while simple color‑coded indicators give an at‑a‑glance view of performance trends.
Finally, the Dashboard sheet turns the numbers into visual insights. Column charts display monthly revenue and profit, a bar chart breaks down profit by product, and KPI cards summarize total revenue, total profit and total sales volume. The layout uses a light background, consistent green (profit) and blue (revenue) accents, and frozen panes keep headings visible while scrolling.
How to use
- Open the Produtos sheet and fill in each product’s details; the dropdown for product IDs will populate automatically.
- Record every sale in the Vendas sheet – select the product ID, enter the date, quantity and unit price; all calculations update instantly.
- Review the Resumo sheet to see aggregated figures for any period; use the filters to focus on specific products or dates.
- Switch to the Dashboard for a visual snapshot of monthly revenue, profit trends and key performance indicators.
Expected benefits: By automating calculations and linking data across sheets, you save time on manual entry, reduce errors, and gain immediate insight into which products drive profit, helping you make faster, data‑driven decisions.
Similar Templates Recommendation
Supermarket Sales & Inventory Profit Tracker Template
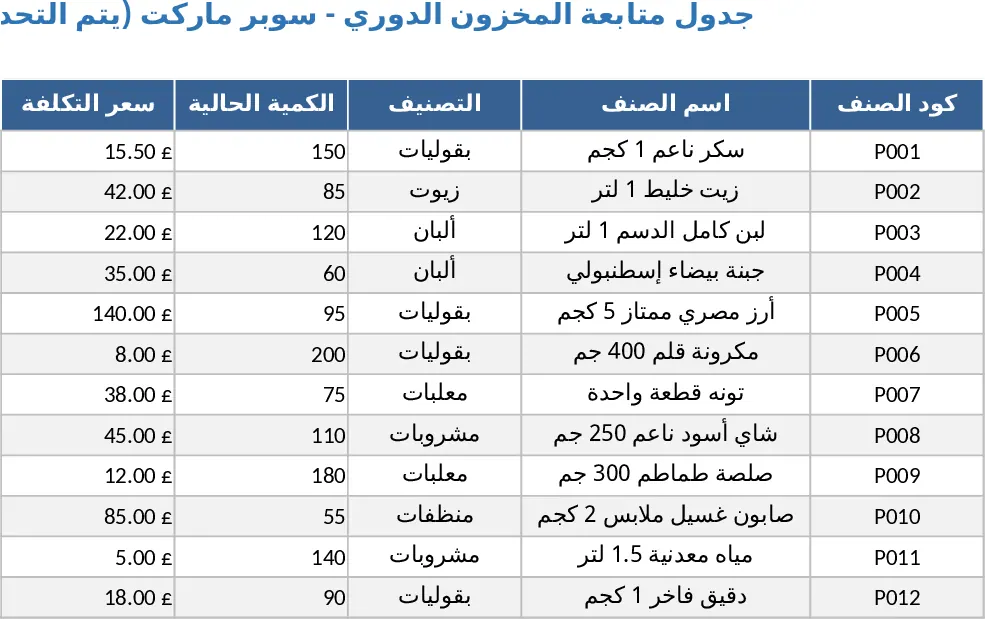
Track daily supermarket sales, monitor inventory levels, and calculate profit margins in a single Excel dashboard.
Pork Cuts Trading Management Dashboard Template
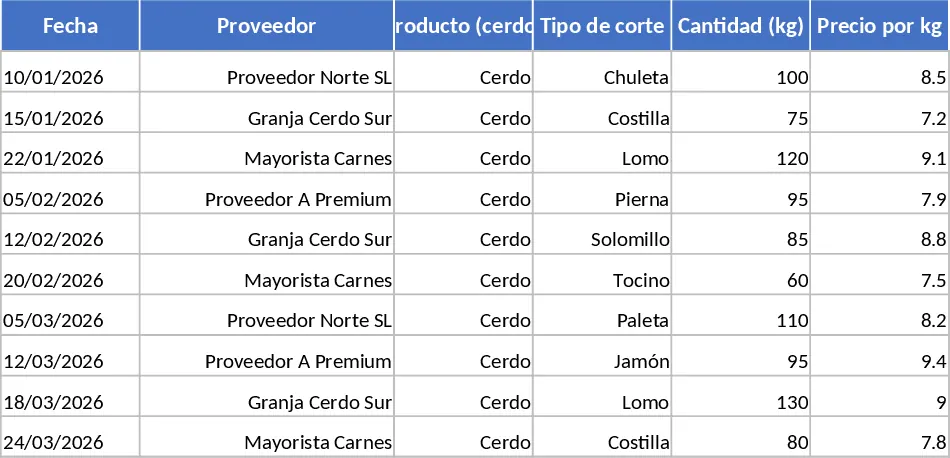
A professional Excel workbook to track pork cut purchases, sales, inventory, customers, and generate dynamic dashboards for profit analysis.
Comprehensive Beauty Product Inventory and Installment Management Template
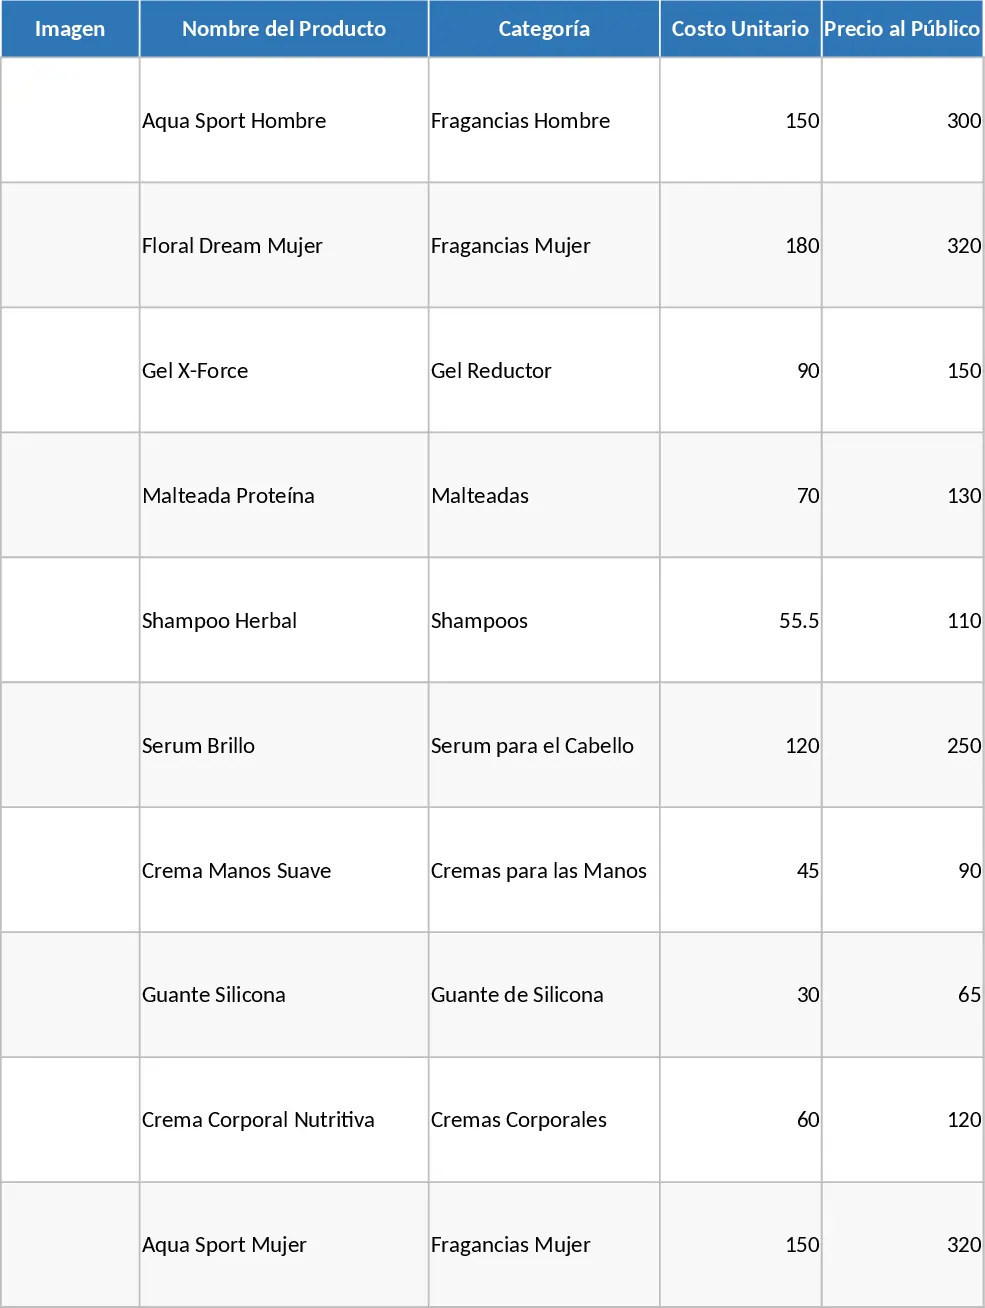
Track categorized product inventory, manage installment payments, and visualize monthly and annual profit trends with automated charts.