Supermarket Sales & Inventory Profit Tracker Template
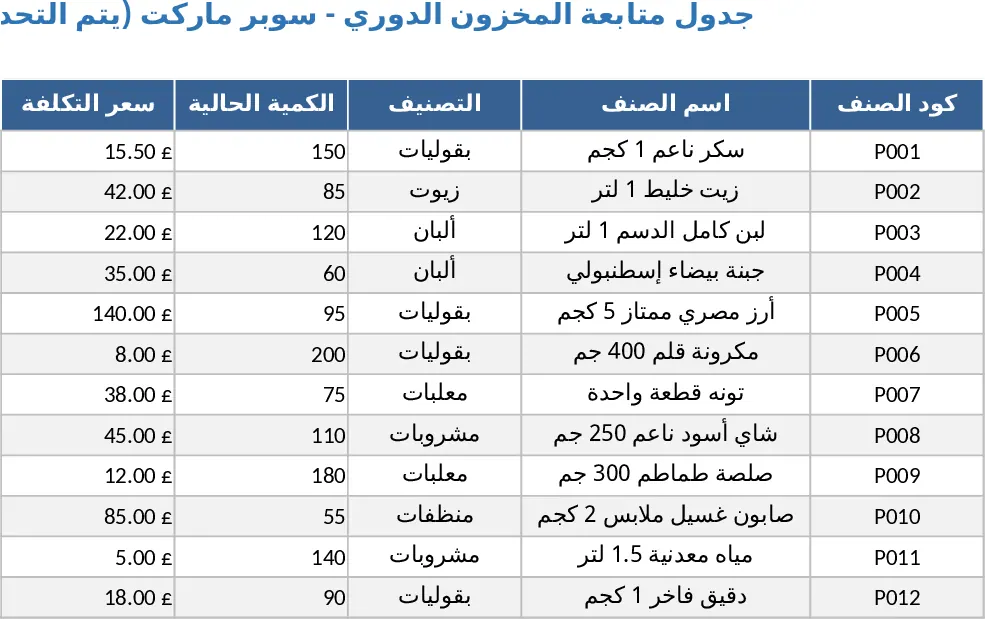
This Excel template is built for supermarket owners and managers who need a clear, real‑time view of their sales performance, stock status, and profit margins. The workbook is split into three main sheets: Sales Log, Inventory Tracker, and Summary Dashboard. In the Sales Log you record each transaction with fields for date, product code, product name, quantity sold, unit price, and any discounts applied. The Inventory Tracker lists every SKU, opening stock, purchases, and automatically updates the current balance as sales are entered. Dropdown menus let you select product names or codes, reducing entry errors. The Summary Dashboard pulls data from the two sheets and shows total sales, total cost of goods sold, gross profit, and margin percentage for any chosen period, plus visual bar charts that highlight top‑selling items and low‑stock alerts.
The template solves the common headache of juggling separate spreadsheets for sales and stock, which often leads to mismatched numbers and missed profit insights. By linking sales entries directly to inventory, the workbook instantly reflects how each sale reduces stock and contributes to the margin calculation. This gives you confidence that you are not over‑selling out‑of‑stock items and that you can spot thin profit lines before they become a problem. It also saves the time spent manually reconciling sales receipts with inventory counts, letting you focus on ordering the right products and optimizing pricing.
Ideal for small‑to‑medium supermarket operators, franchise managers, and anyone responsible for daily store operations. Whether you run a single outlet or oversee several locations, the template can be duplicated per store and then consolidated for a regional view. It is especially useful during promotional periods when discounts and rapid stock turnover make manual tracking impractical.
How to use
- Open the workbook and go to the Sales Log sheet. Enter each sale row by selecting the product from the dropdown, filling quantity, unit price, and any discount. The "Total Sale" column calculates automatically.
- Switch to the Inventory Tracker sheet. The "Current Stock" column updates in real time based on the sales you just entered and any purchase receipts you add in the "Purchases" column.
- Navigate to the Summary Dashboard. Choose the date range from the filter cells to see total revenue, cost of goods sold, gross profit, and margin % for that period. Bar charts will highlight best‑selling items and items that are below the reorder threshold.
- Review the alerts and adjust your ordering plan or pricing strategy accordingly.
Expected benefits: By consolidating sales, stock, and profit calculations into one live workbook, you cut down on manual data entry and reconciliation, gaining quicker insights that help you keep shelves stocked and margins healthy.
Similar Templates Recommendation
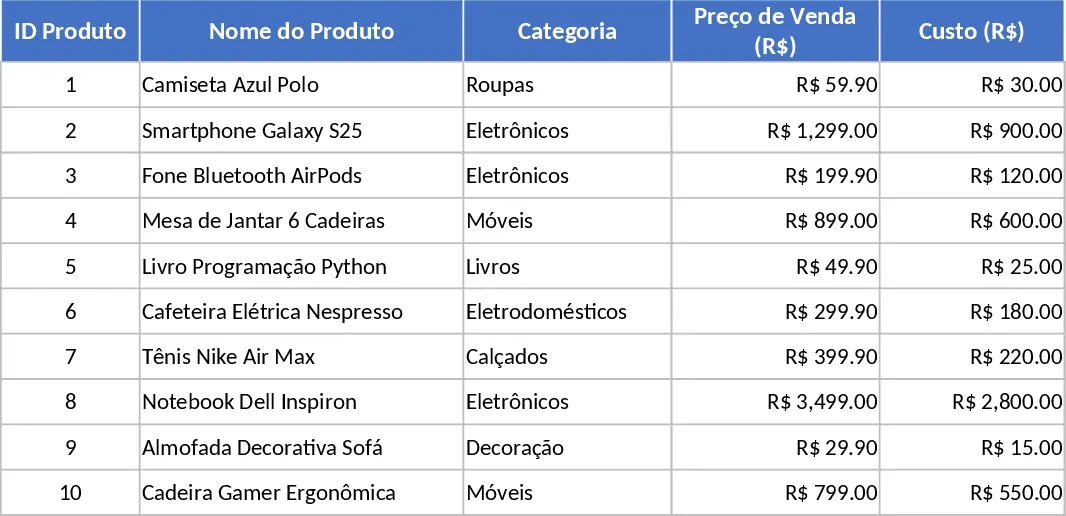
Automated Pricing Calculator and Inventory Profit Control Template
Determine optimal product pricing and manage stock levels with automated formulas that calculate gross and net profit for your business.
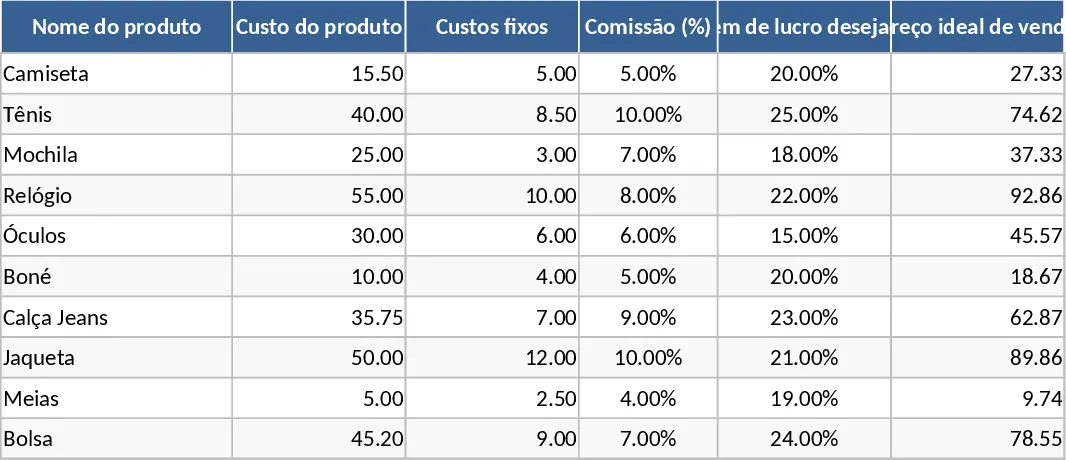
Product Inventory Sales and Expense Tracker Template
Manage your small business inventory, track daily sales revenue, and monitor operational expenses to calculate real-time profit margins.
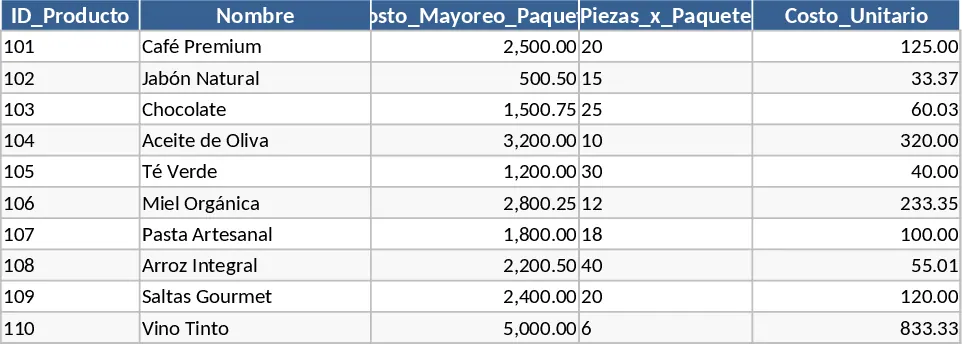
Mercado Libre Sales Performance Dashboard Template
Track and analyze your Mercado Livre product sales, costs, profits and daily performance with automated tables, charts and a dashboard.