Monthly Stock Inventory Tracker Template
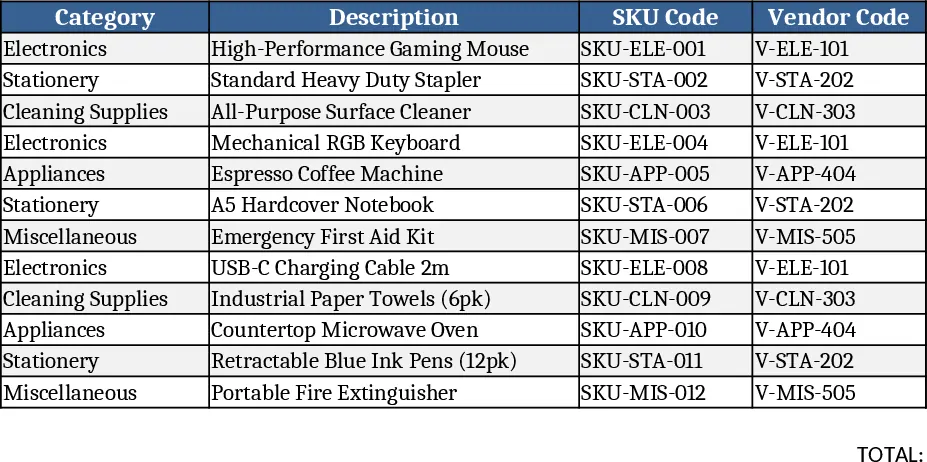
This Excel template provides a single, easy‑to‑use worksheet designed for monthly inventory tracking. Each row represents one stock item and includes columns for Category (with a dropdown of common groups), Item Description, SKU Code, Vendor Code, and Quantity on Hand. A small summary section at the top automatically calculates total units per category and overall stock value if you add a Unit Cost column. The layout is simple: the first row holds headers, the second row starts your data entry, and the bottom rows contain formulas that update instantly as you modify quantities.
The template solves the everyday headache of keeping inventory records scattered across emails, paper notes, or multiple files. By consolidating all essential details into one sheet, you can instantly see which product lines are low, which vendors supply the most items, and how your stock levels change month over month. This visibility reduces the risk of stockouts, helps plan re‑orders, and streamlines communication with suppliers. It’s especially valuable for small‑to‑mid‑size businesses, warehouse supervisors, and anyone responsible for maintaining accurate stock counts without investing in complex ERP systems.
Who benefits most? Store managers, procurement officers, and operations teams that need a quick snapshot of inventory health each month. Whether you run a retail boutique, a manufacturing floor, or an e‑commerce fulfillment center, the template adapts to any product range. It tracks the core metrics you care about—item count, vendor association, and category distribution—so you can make data‑driven decisions about purchasing, shelving, and sales planning.
How to use
- Open the workbook and go to the "Inventory" sheet. Select the appropriate category from the dropdown in column A for each item.
- Fill in the Item Description, SKU Code, Vendor Code, and the current Quantity on Hand for the month.
- If you want monetary insight, add a Unit Cost column and the template will compute total value per line and per category.
- Review the summary area at the top; it automatically aggregates totals and highlights any category where quantity falls below a preset threshold (you can adjust the threshold in the Settings cell).
Expected benefits: By centralising data entry and automating totals, you’ll spend far less time compiling reports, reduce manual errors, and gain a clearer picture of inventory trends each month.
Similar Templates Recommendation
Comprehensive Inventory Management Tracker with Sample Data Template
Track items, movements, and stock levels with automatic reorder alerts in a three‑sheet Excel template.
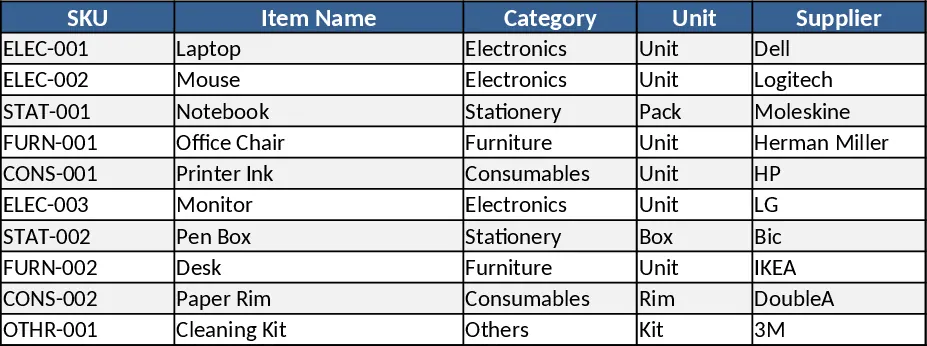
Basic Inventory Tracker Template
Track stock levels, monitor reorder points, and generate inventory reports with a simple, multi‑sheet Excel template.
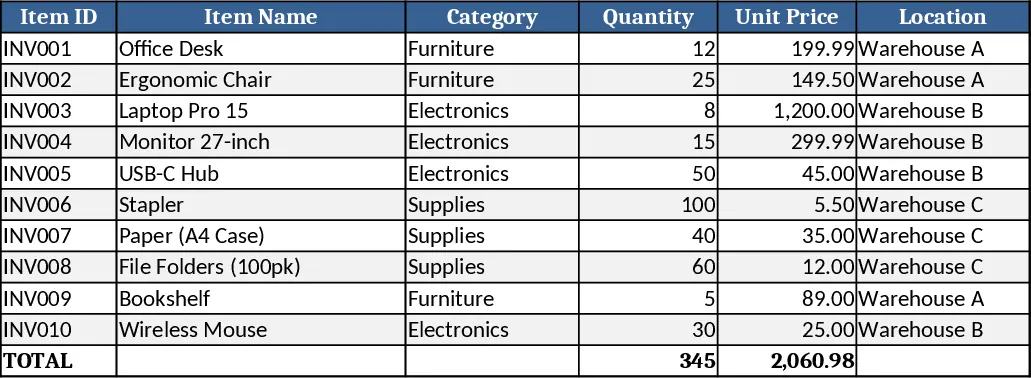
Multi-Column Inventory Tracker Template
A multi‑column inventory template to log, categorize, and track items, quantities, locations, and status in one spreadsheet.