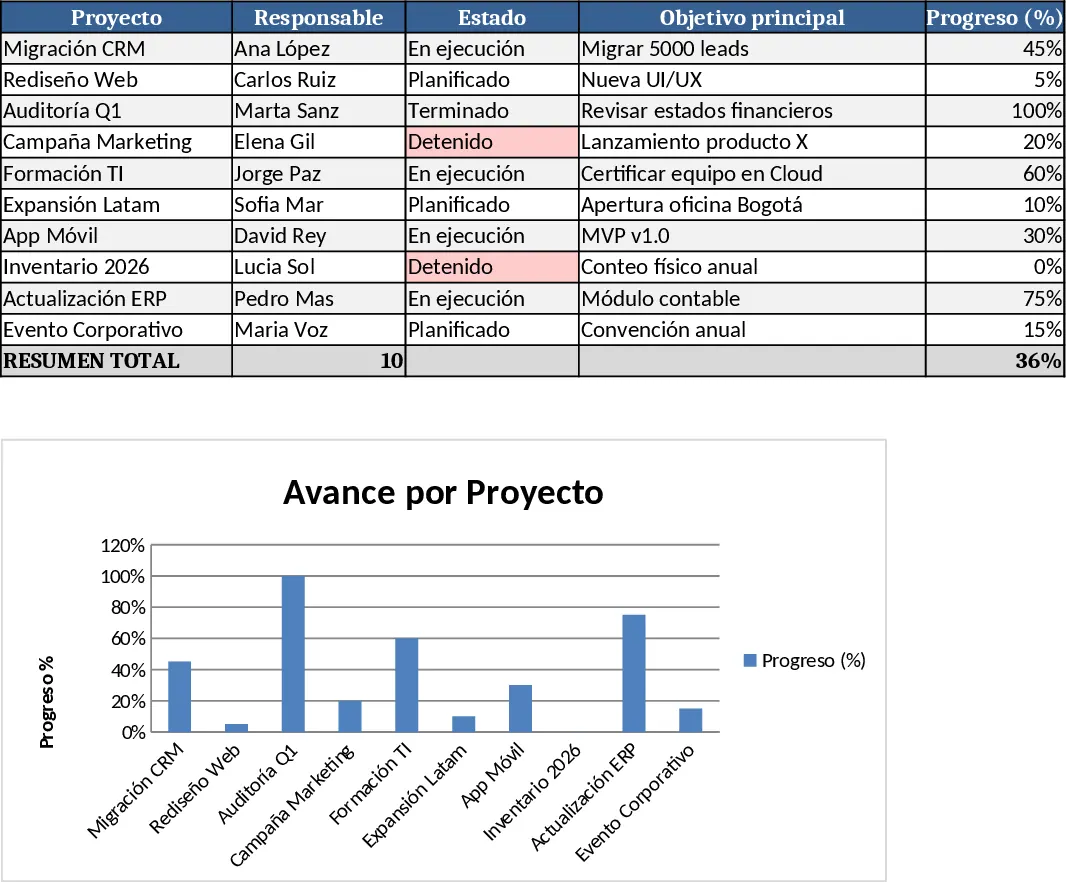
Gantt Chart Project Plan with Tasks, Timeline, and Summary Template
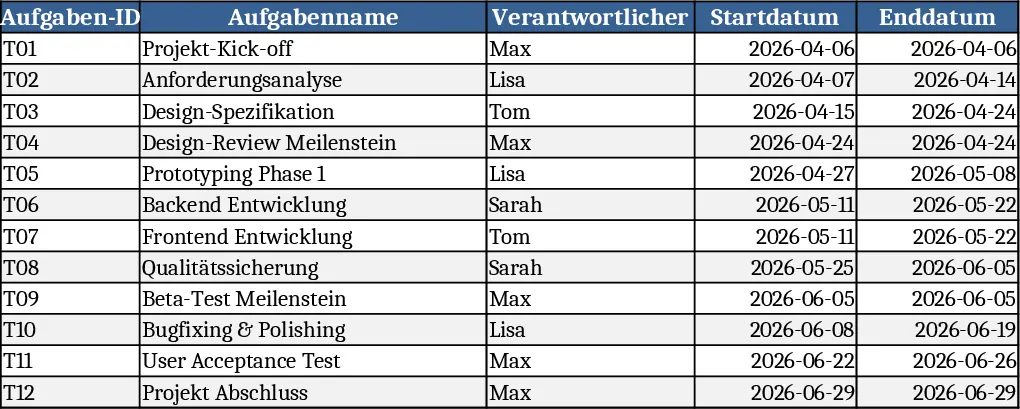
This Excel template gives you a complete Gantt‑style project plan in three linked worksheets. The Tasks sheet holds a table with columns for Task ID, Name, Owner, Start Date, End Date, automatically calculated Duration, Status, % Complete, Dependencies, Milestone flag and Notes. Validation ensures End Date is never earlier than Start Date, and the Duration formula updates instantly. The Timeline sheet creates a daily or weekly calendar for any date range you choose; conditional formatting reads the start and end dates to paint Gantt bars and places a distinct marker for milestone rows. The Summary sheet aggregates the data, showing counts of tasks by status, a weighted overall % complete, and a quick list of critical or overdue items. Twelve sample tasks spanning eight weeks illustrate how the sheets work together.
The template solves the common headache of keeping project schedules, resource assignments and progress metrics in sync. By centralising task details and automatically generating the visual timeline, you avoid manual chart drawing and reduce the risk of mismatched dates. The summary dashboard instantly tells you where bottlenecks lie, which milestones are on track, and how much work remains, helping you make data‑driven decisions without switching between multiple tools.
Project managers, team leads, and anyone responsible for delivering time‑bound initiatives will find this layout immediately useful. Whether you are running a product launch, a construction phase, or an internal software rollout, the sheet adapts to any industry because the fields are generic yet powerful. It works especially well for small‑to‑medium teams that need a low‑cost, offline solution while still wanting the visual clarity of a Gantt chart.
With this template you can track every essential element of a project: who owns each task, when work starts and finishes, how long it should take, its current status, percentage completed, and any predecessor relationships that affect scheduling. The Milestone flag highlights key delivery points, and the conditional‑formatted timeline turns raw dates into an at‑a‑glance visual schedule. The summary sheet turns those details into actionable insights, such as the number of tasks in each status bucket and a weighted completion percentage that reflects the true progress of longer activities.
How to use
- Open the workbook and go to the Tasks sheet. Enter your project’s tasks, filling in the required columns; the Duration column will calculate automatically and the sheet will warn you if any End Date precedes its Start Date.
- Switch to the Timeline sheet, set the desired start and end dates for the overall schedule, and watch the Gantt bars appear based on the data you entered.
- Review the Summary sheet to see status counts, overall progress and any tasks flagged as critical or delayed. Adjust task details as needed and the dashboard updates in real time.
You’ll notice a noticeable cut in the time spent aligning dates, updating charts and compiling status reports, letting you focus more on delivering results than on manual spreadsheet gymnastics.
Similar Templates Recommendation
Project Gantt Chart Planner Template
A ready‑to‑use Excel Gantt chart template with task list, timeline view and summary dashboard for tracking project progress.
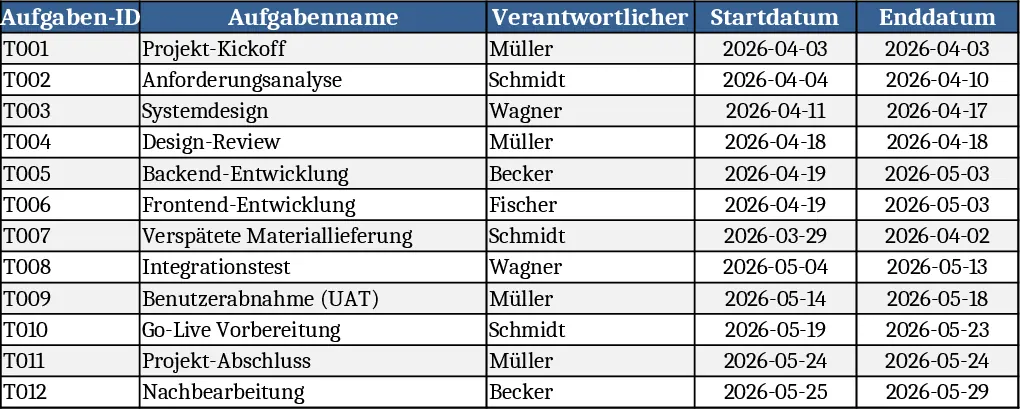
All-in-One Project Management Template
A comprehensive Excel template to plan, detail, execute, track and monitor all your projects step by step.
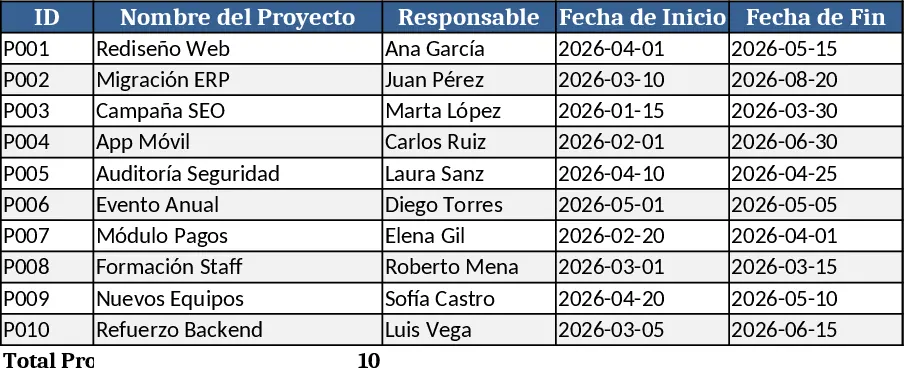
Multi-Project Planner with Dashboard Template
A comprehensive Excel template to plan, execute, and monitor projects with detailed steps, timelines, objectives, and visual dashboards.