Project Gantt Chart Planner Template
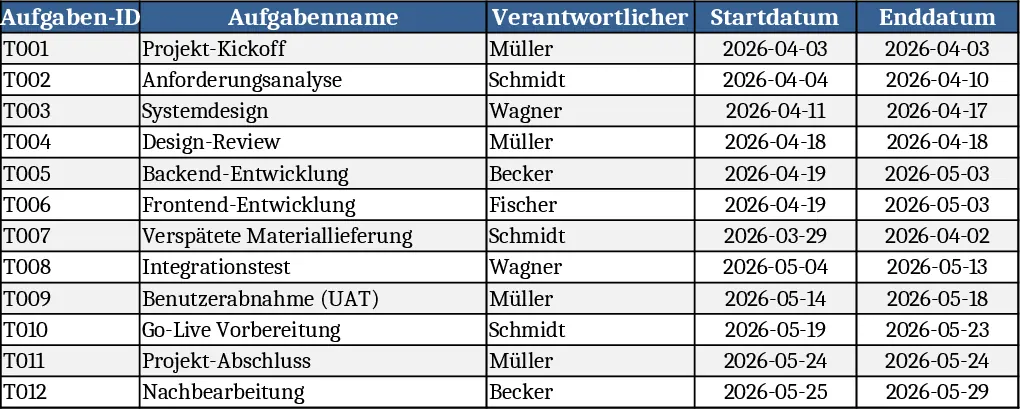
This Excel Gantt‑Project‑Plan template is built on three interconnected worksheets that let you capture every detail of a project and instantly visualise it as a classic Gantt chart. The Tasks sheet holds a structured task register with columns for Task ID, Name, Owner, Start Date, End Date, automatically calculated Duration, Status, % Complete, Dependencies, Milestone flag and free‑form Notes. Built‑in formulas enforce that End Date cannot precede Start Date and compute Duration as End‑Start+1, so you never have to manually adjust lengths. The Timeline sheet generates a daily or weekly calendar for any date range you select, then uses conditional formatting to paint coloured bars that stretch from each task’s start to its end date. Milestones appear as distinct markers, making critical dates pop out at a glance. Finally, the Summary sheet aggregates the data: it counts tasks by Status, calculates a weighted overall % Complete (weight = Duration), and lists any tasks flagged as critical or overdue, giving you a quick health snapshot.
The template solves the common headache of juggling spreadsheets, manual charts and separate status reports. By linking the three sheets, any change you make in the task register instantly reshapes the timeline and updates the summary metrics, eliminating duplicate work and reducing the risk of inconsistent data. Project managers can instantly see which activities are on track, which are slipping, and where bottlenecks may form, enabling faster corrective action. The built‑in example set of 12 tasks spread over eight weeks demonstrates typical phases—initiation, design, development, testing and rollout—so you can see the layout in action and replace the sample rows with your own work breakdown structure.
Who benefits most? Project coordinators, PMO analysts, team leads, or anyone responsible for planning and monitoring timelines in small‑to‑medium initiatives. It works equally well for product launches, marketing campaigns, IT implementations or any effort that follows a linear schedule with dependencies. The template helps you track start/end dates, progress percentages, responsibility assignments, and milestone achievements, turning raw data into a visual schedule and a concise performance dashboard.
How to use
- Open the workbook and go to the Tasks sheet. Enter your own tasks, assign owners, set start and end dates, and mark any milestone rows with “Yes”. The Duration column fills automatically and the % Complete column can be edited as work progresses.
- Switch to the Timeline sheet, select the desired date range from the dropdown, and watch the Gantt bars appear. Adjust the view (daily or weekly) if you need a broader or finer granularity.
- Review the Summary sheet to see counts by status, the weighted overall completion rate, and a highlighted list of critical or delayed tasks. Use this view for status meetings or executive updates.
Expected benefits include a noticeable cut in the time spent building and updating project schedules, fewer manual errors, and a clearer, instantly shareable visual of project health.
Similar Templates Recommendation
All-in-One Project Management Template
A comprehensive Excel template to plan, detail, execute, track and monitor all your projects step by step.
Gantt Chart Project Plan with Tasks, Timeline, and Summary Template
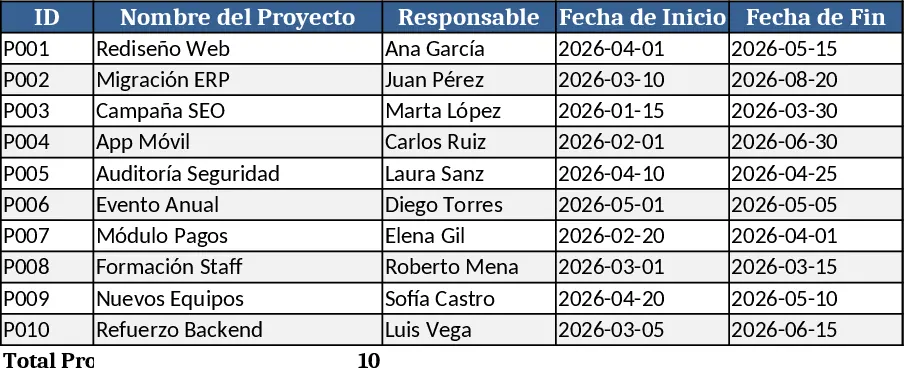
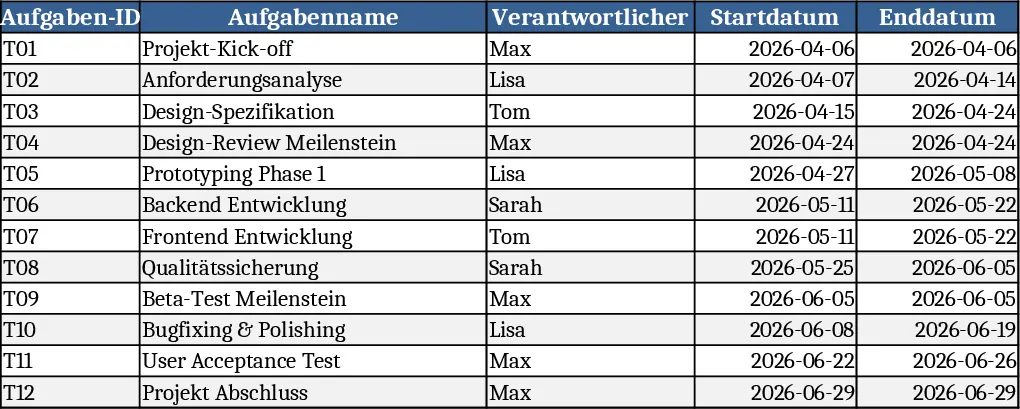
A ready‑to‑use Excel Gantt chart template with task list, timeline view and summary dashboard for tracking project progress.
Multi-Project Planner with Dashboard Template
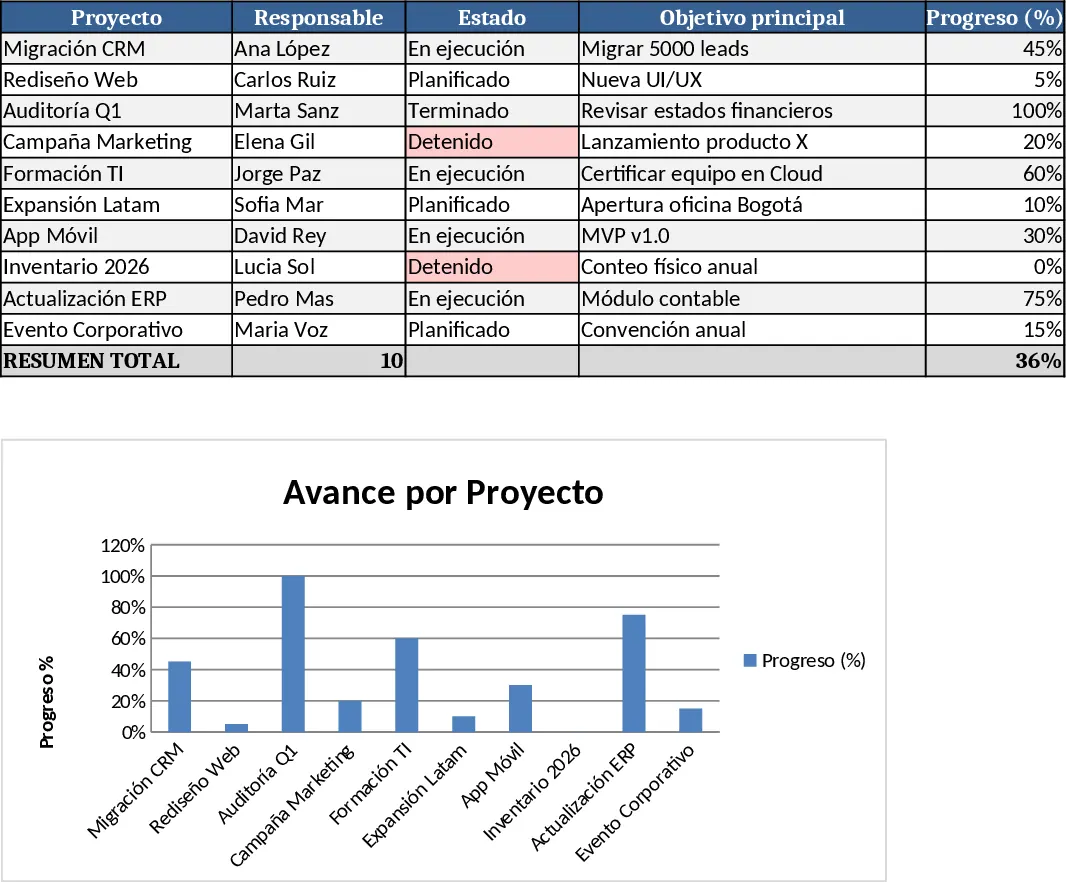
A comprehensive Excel template to plan, execute, and monitor projects with detailed steps, timelines, objectives, and visual dashboards.