Car Purchase Decision Scoring Template
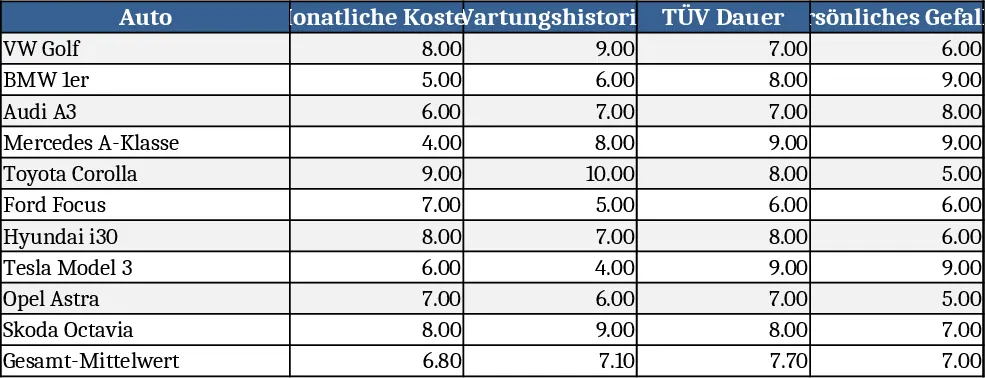
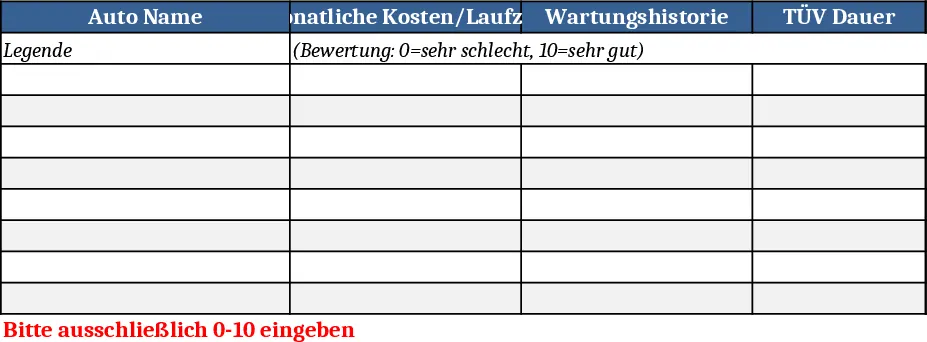
This template provides a clear, side‑by‑side comparison of any number of car models using a simple numeric rating system. The workbook contains a main sheet where each row represents a car and five columns capture the key criteria you listed: monthly cost/lifespan, maintenance history, TÜV duration, personal appeal, and expected mileage performance. For every car‑criterion intersection you enter a score from 0 (worst) to 10 (best). The sheet automatically calculates the average of the five scores for each vehicle, highlighting the highest‑scoring model as the recommended purchase. A secondary summary sheet visualises the results with a bar chart and a conditional‑formatting table, so you can instantly see which cars excel overall or in specific areas.
The matrix solves the common headache of juggling subjective impressions and hard numbers when deciding on a new vehicle. By converting each factor into a comparable score, you eliminate bias and gain a transparent, data‑driven recommendation. It’s especially useful for individuals or small teams who need to justify a purchase to stakeholders, compare fleet options, or simply organise personal preferences in a structured way. The template saves you from manually averaging scores in separate spreadsheets and ensures every important aspect—cost, reliability, legal compliance, personal taste, and mileage expectations—is accounted for.
Ideal users are prospective car buyers, fleet managers, or anyone evaluating multiple vehicle options. Whether you’re choosing a family sedan, a business van, or a weekend sports car, the matrix adapts to any number of models and lets you adjust the importance of each criterion by simply changing the scores. The result is a single, objective ranking that supports confident decision‑making.
How to use
- List each car model in the first column of the "Scoring" sheet.
- Enter a score between 0 and 10 for each of the five criteria in the corresponding columns.
- The "Average Score" column updates automatically; the highest average is highlighted.
- Switch to the "Summary" sheet to view a bar chart of all averages and a quick‑look table of top performers.
Expected benefits: reduces the time spent juggling spreadsheets, provides a transparent recommendation, and helps align all decision factors in one view.