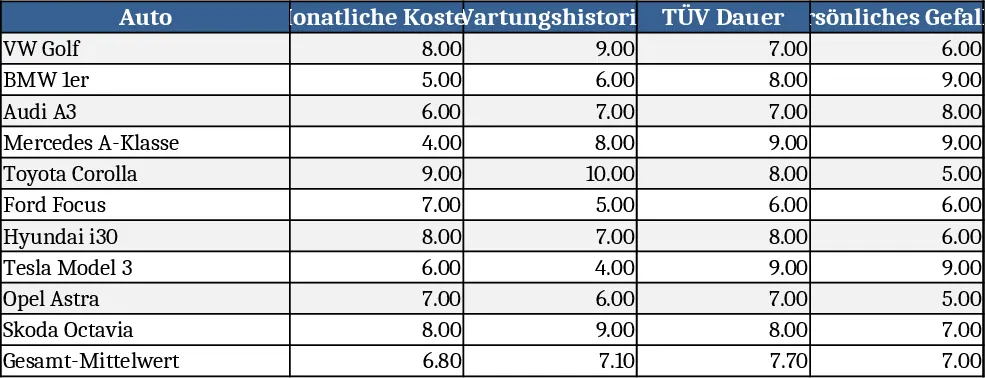
Car Purchase Decision Matrix Template
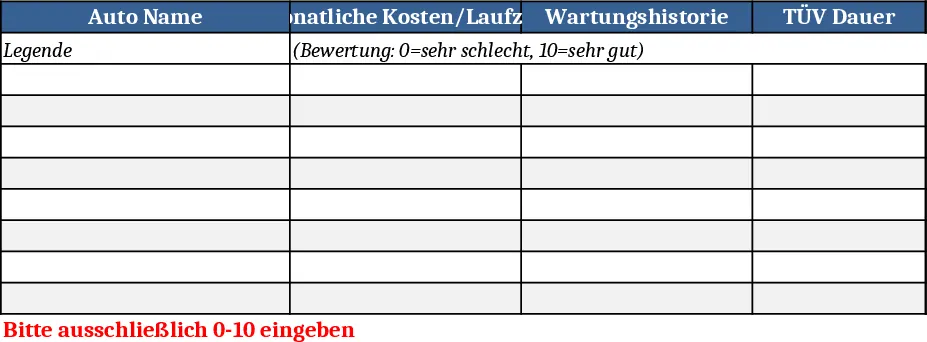
This template provides a clear, numeric decision matrix for evaluating several car models against five key purchase criteria. The workbook contains a single sheet where you list each car in the first column and then enter a score from 0 to 10 for each of the following categories: monthly cost/lifespan, maintenance history, TÜV duration, personal appeal, and expected mileage performance. A simple average formula calculates the overall score for each vehicle, automatically ranking the options from most to least recommended.
The matrix solves the common problem of subjective car shopping by turning opinions into comparable numbers. Instead of juggling notes or spreadsheets with mixed formats, you get a single, structured view that highlights strengths and weaknesses at a glance. It saves time during research, reduces bias, and helps you justify your final choice with data that can be shared with family, colleagues, or financial advisors.
Ideal for anyone who is in the market for a new or used car—whether you’re a private buyer, a fleet manager, or a small‑business owner needing to add a vehicle to the fleet. The template works equally well for personal decisions and for professional procurement processes where multiple stakeholders need a transparent evaluation method.
What you track: each car’s name (free‑text entry), five numeric ratings, the calculated average, and an automatic ranking. The summary view instantly shows which model scores highest, making it easy to spot the best overall option or to drill down into specific categories if you want to prioritize cost over personal appeal, for example.
How to use
- In column A, type the names of the cars you want to compare. Add as many rows as needed.
- For each car, fill in a number between 0 (poor) and 10 (excellent) in columns B‑F for the five criteria listed above.
- The template will compute the average score in column G and display a rank in column H; you can sort by rank to see the top recommendation.
- Review the summary row at the bottom, which highlights the highest‑scoring vehicle and shows the overall average across all cars.
Expected benefits: a faster, more objective decision process, reduced spreadsheet clutter, and a clear visual ranking that helps you choose the right car with confidence.