Travel Expense Report Template
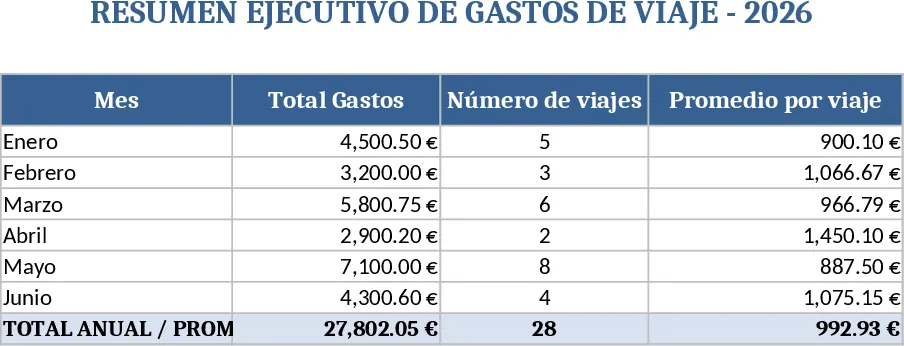
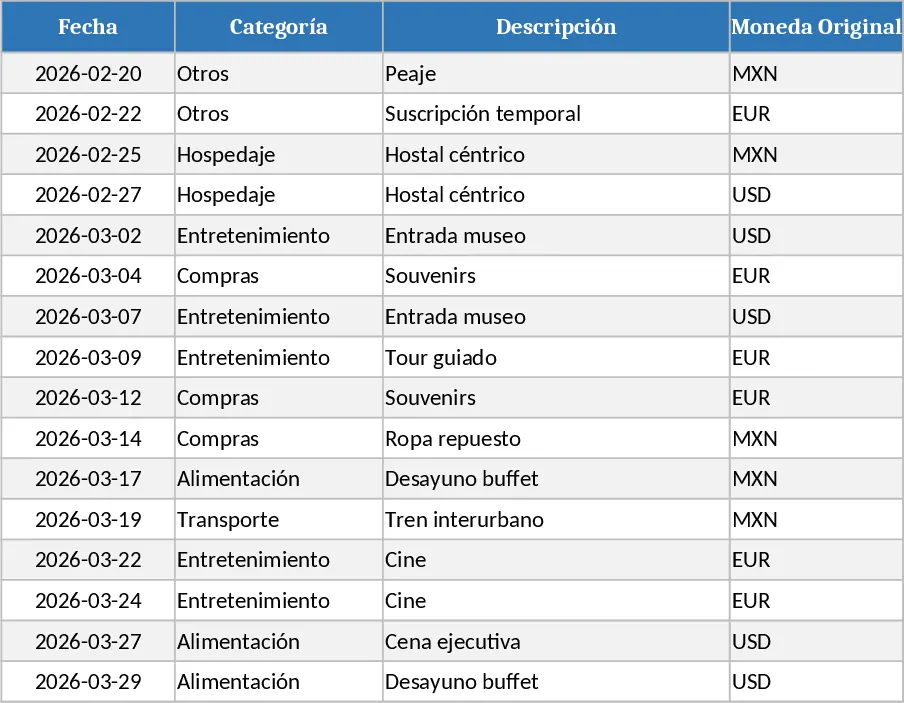
This Travel Expense Register template is organized into three main sheets: Input, Summary, and Dashboard. In the Input sheet you’ll find rows for each trip with columns for date, destination, purpose, transportation mode, accommodation, meals, miscellaneous costs, currency, exchange rate, and a brief description. Dropdown lists standardize categories (e.g., Flight, Hotel, Meals, Taxi) and currencies, while formulas automatically convert foreign amounts to your base currency. The Summary sheet aggregates totals by category, by employee, and by month, providing a clear view of where travel money is spent. The Dashboard presents key metrics—total spend, average cost per trip, top expense categories—in easy‑to‑read charts.
The template solves the common headache of scattered receipts and manual calculations. By centralizing every travel cost in one place, it eliminates duplicate entries, reduces errors in conversion, and speeds up the reimbursement process. Managers can instantly see budget overruns, finance teams can generate month‑end reports with a click, and employees get a transparent view of their own spending. This leads to better cost control, faster approvals, and more accurate forecasting for future travel budgets.
Ideal for finance analysts, travel coordinators, project managers, and any employee who regularly travels for work. Whether you’re a small business handling a handful of trips or a larger organization with dozens of itineraries each month, the template scales to fit your needs. It helps you track each expense line‑item, manage approvals, and produce a clean, printable expense report ready for submission.
How to use
- Open the Input sheet and add a new row for each travel expense. Select the appropriate category and currency from the dropdowns, then fill in the date, amount, and any notes.
- Enter the exchange rate if the expense is in a foreign currency; the template will auto‑calculate the amount in your base currency.
- Switch to the Summary sheet to review aggregated totals. Adjust the date filters at the top to see monthly or quarterly views.
- Use the Dashboard to visualize spending patterns. Export the charts or copy the summary tables for inclusion in your finance reports.
Expected benefits: streamlined data entry, reduced manual calculations, quicker reimbursement cycles, and clearer insight into travel spending, saving you hours of spreadsheet juggling each month.