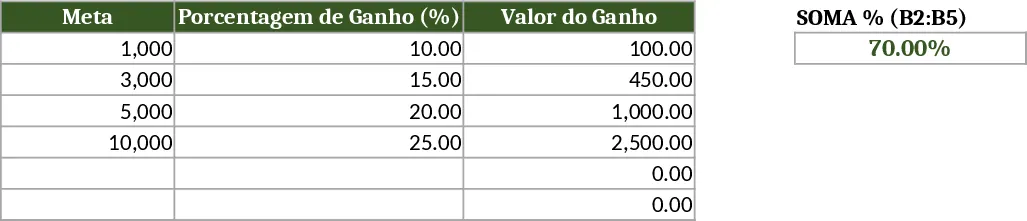
Monthly Sales Report Template
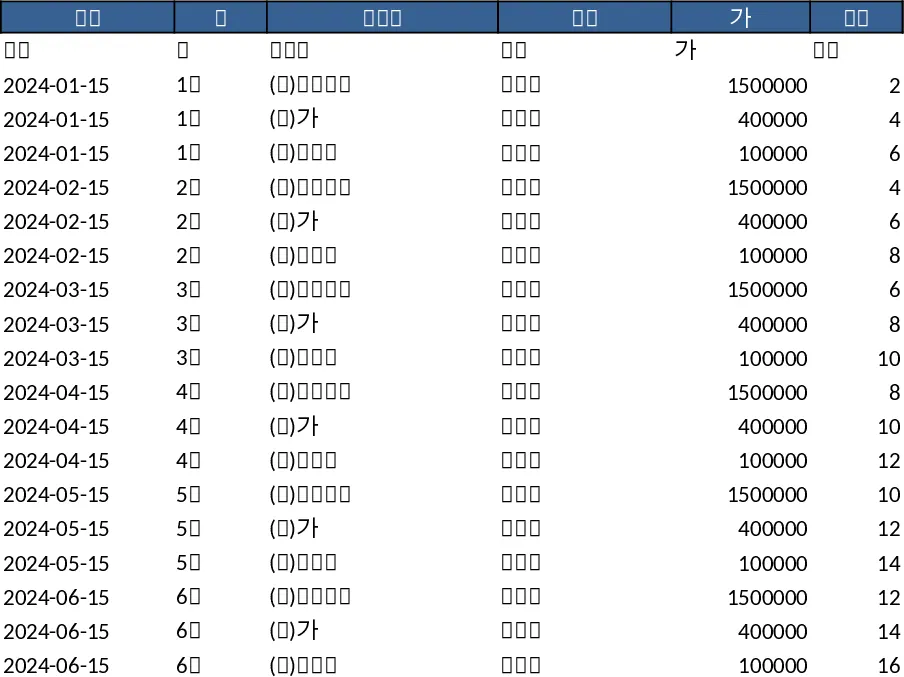
This Excel sales‑report template is built for anyone who needs a clean, repeatable way to turn raw sales numbers into a polished, data‑driven report. The workbook is divided into three main sheets: Data Input, Summary, and Charts. In the Data Input sheet you record each transaction with fields such as Date, Product, Region, Salesperson, Units Sold, Revenue, Cost, and Margin. Dropdown menus for Product and Region keep entries consistent and prevent typos. The Summary sheet automatically aggregates the data, showing total revenue, average margin, month‑over‑month growth, top‑selling products, and sales by region. The Charts sheet pulls those key metrics into ready‑to‑publish visuals – bar charts for product performance, line graphs for trend analysis, and a pie chart for regional distribution. All calculations are powered by built‑in formulas, so you never have to write a single function yourself.
The template solves the common headache of manually copying numbers into separate documents, reconciling totals, and creating charts from scratch. By centralising data entry and automating the analysis, it frees up hours each month that would otherwise be spent on repetitive spreadsheet work. Managers get an instantly updated snapshot of how the business is performing, enabling faster decisions on inventory, pricing, and sales strategy. Small business owners, regional sales leads, and analysts will all find the same value – a single source of truth that eliminates errors and presents the story behind the numbers in a clear, visual format.
Designed for sales teams that need to report on a regular cadence, the template helps you track revenue trends, monitor key performance indicators, and compare performance across products and territories. Because the calculations are live, you can experiment with "what‑if" scenarios by simply adjusting the input rows – the summary and charts will refresh instantly, showing you the impact of price changes, promotional periods, or new product launches.
How to use
- Open the workbook and go to the Data Input sheet. Add a new row for each sale, selecting the appropriate product and region from the dropdown lists and filling in the numeric fields.
- Switch to the Summary sheet; the totals, growth percentages, and top‑line metrics update automatically as you add data.
- Review the visualizations on the Charts sheet; they reflect the latest numbers and are ready to copy into presentations or export as images.
- When the month is closed, use the built‑in print layout to generate a PDF or share the Excel file with stakeholders.
Expected benefits include a noticeable reduction in time spent on data consolidation, fewer manual errors, and a more professional look for your monthly sales reports, all without needing advanced Excel skills.
Similar Templates Recommendation
Professional Sales Closing Dashboard Template
A ready‑to‑use Excel dashboard that lets you input monthly sales data and instantly see KPI summaries, trend charts and detailed tables for executive reporting.
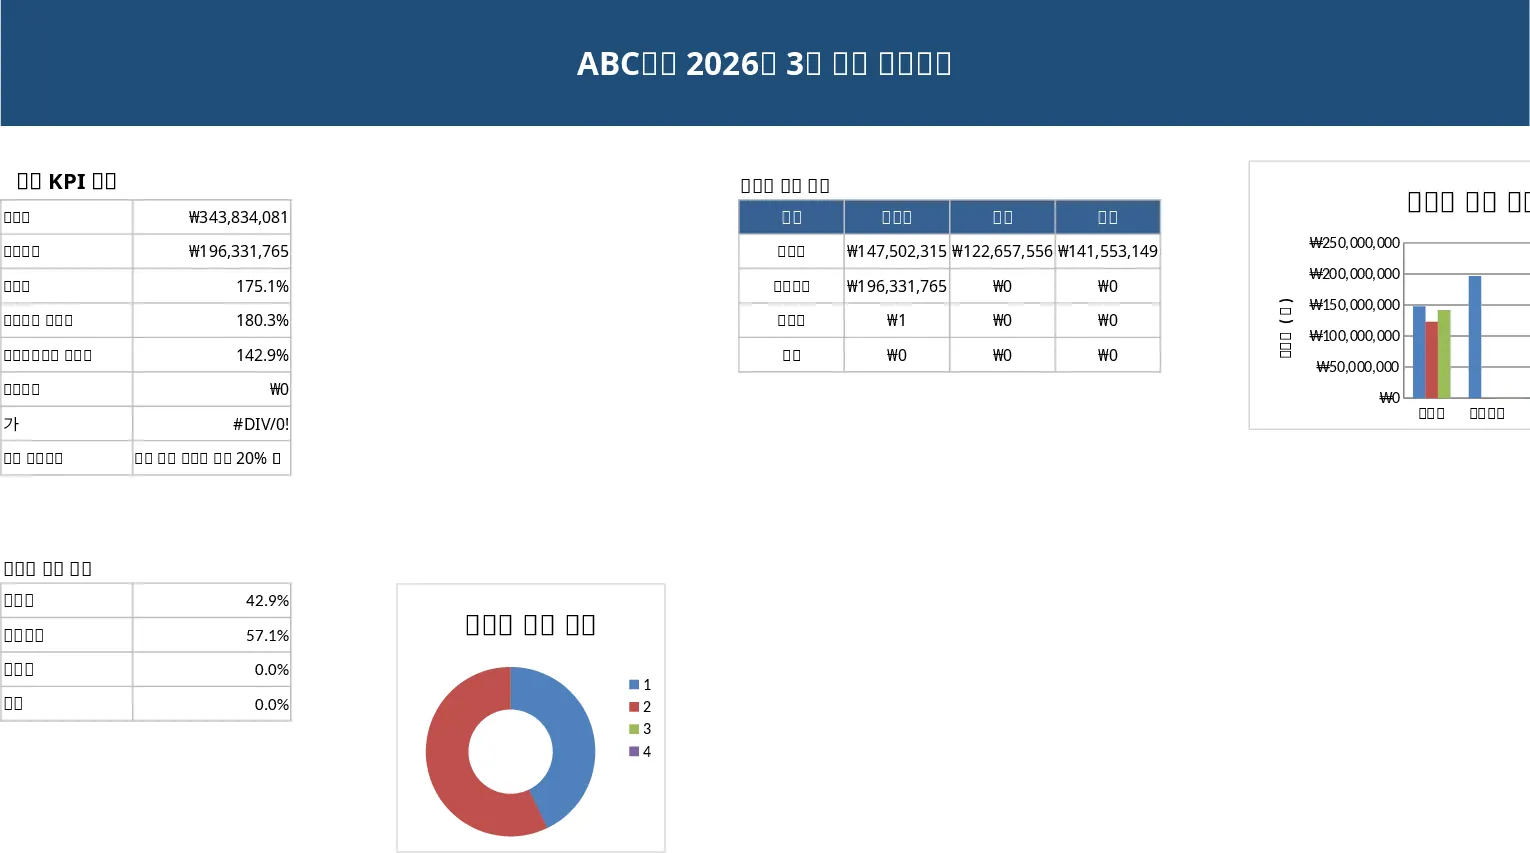
Monthly Business KPI Dashboard Excel with Charts Template
Track monthly business performance with an interactive KPI dashboard that visualizes revenue, costs, leads, conversions and top products.
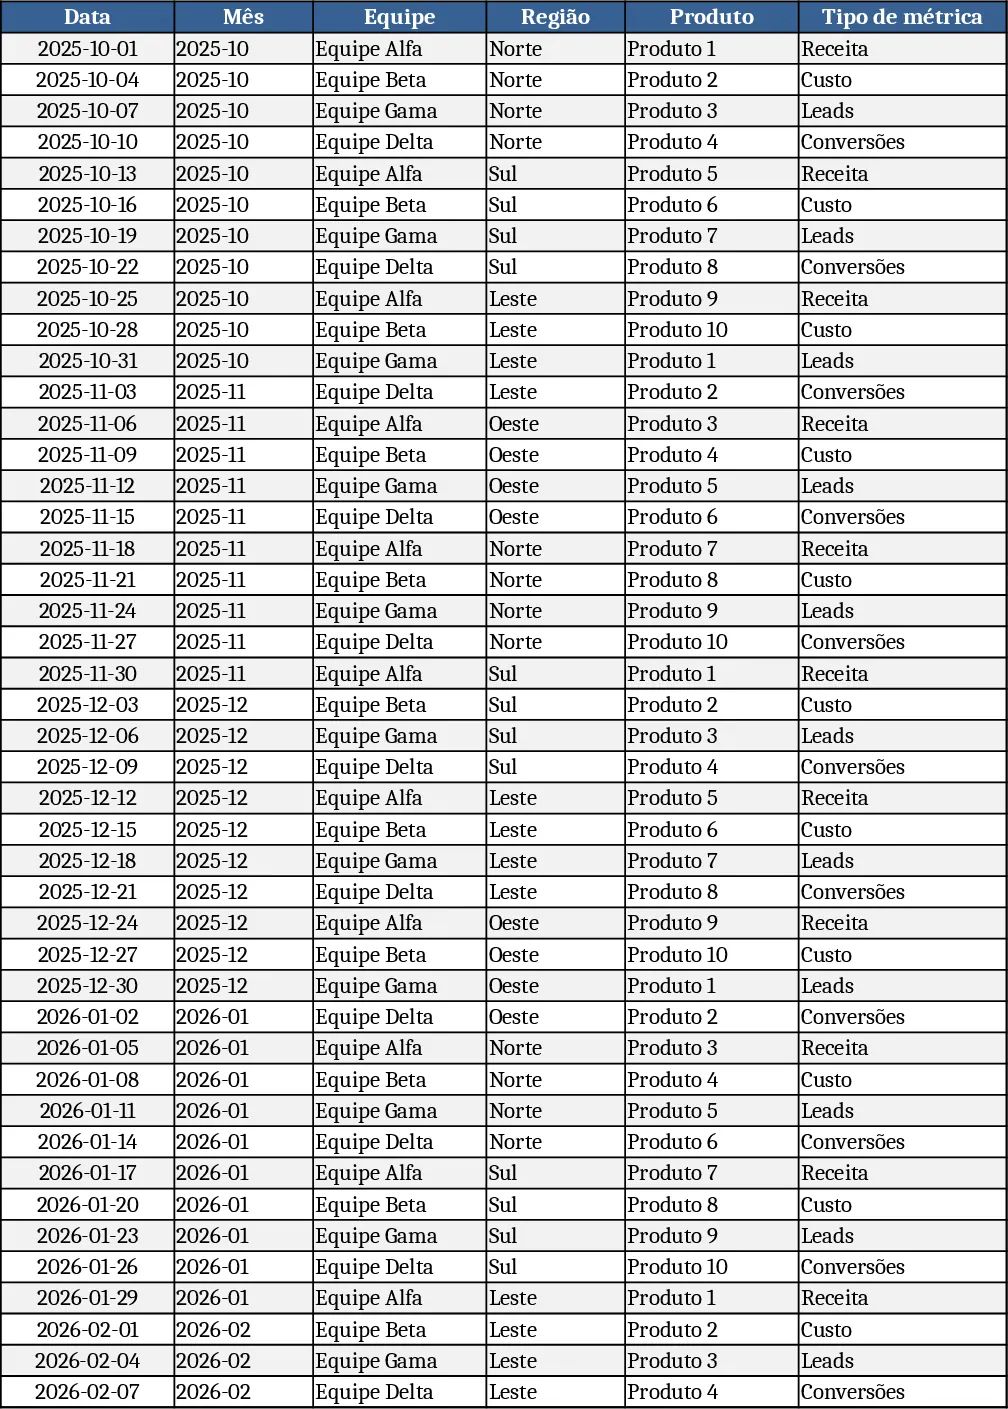
Sales Targets Tracker Template
Track sales per client, dates and amounts, compare against set targets, and see total achieved at a glance.