Sales Targets Tracker Template
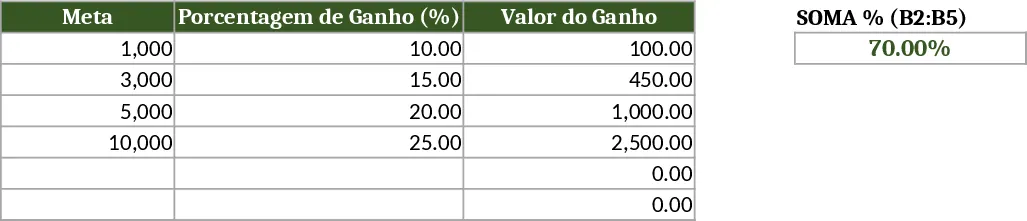
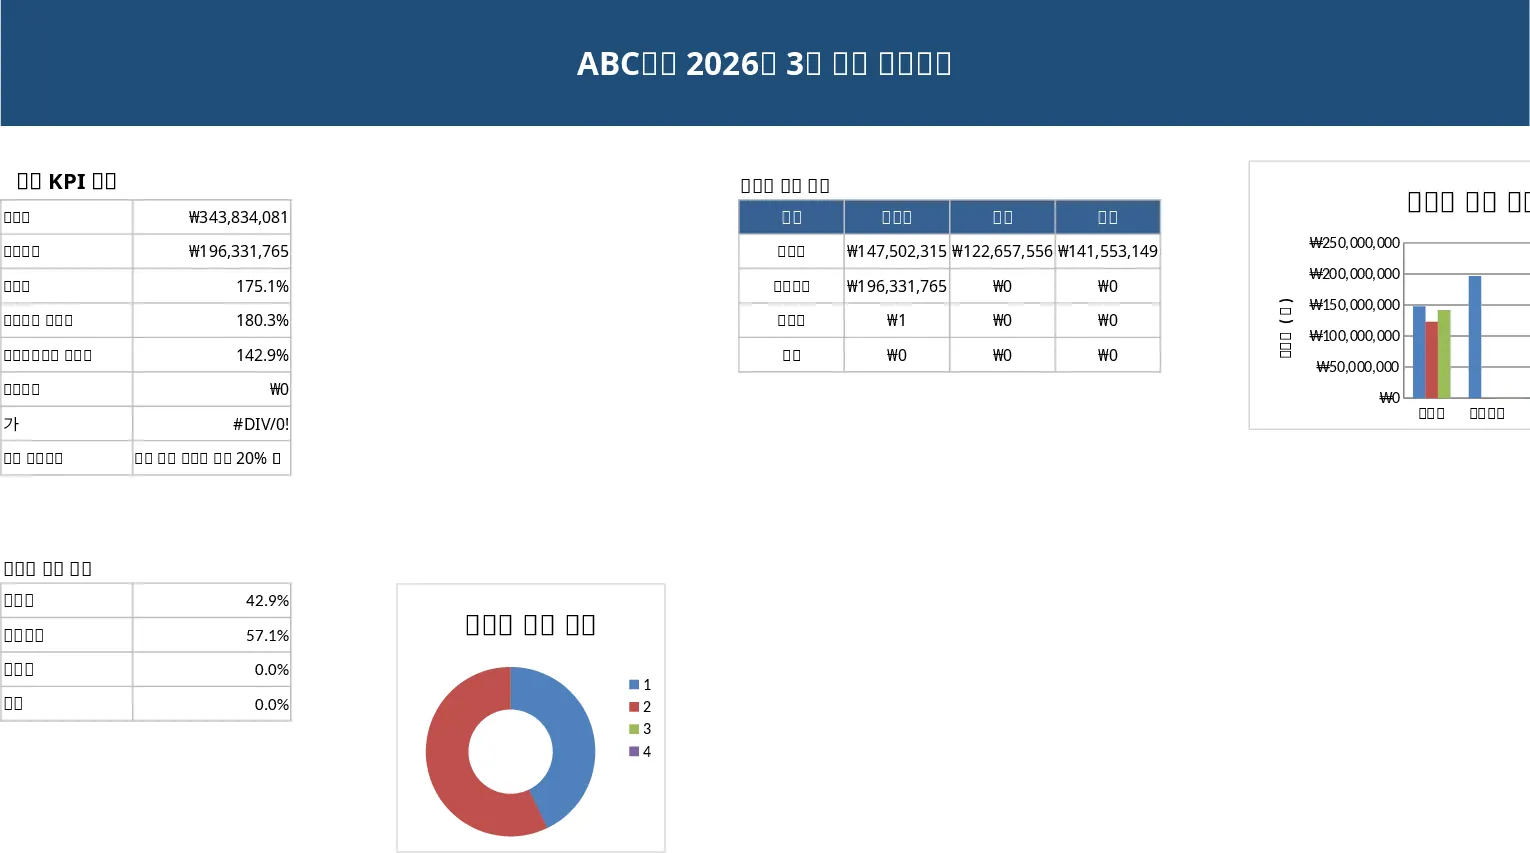
This template is built with three simple sheets: Sales Data, Targets, and Summary. In the Sales Data sheet you’ll find columns for Client Name, Sale Date, Sale Value and a free‑text Description of each transaction. The Targets sheet lets you enter the sales goal for any period – weekly, monthly or quarterly – in a clear table. The Summary sheet automatically pulls the numbers from the first two sheets, calculates the total sales, the total target, and shows the variance. It also includes a small chart that visualises progress toward the goal, so you can instantly see whether you’re on track.
The template solves the common headache of manually consolidating sales records and constantly checking if you’ve hit your quota. By centralising every sale and its associated target in one place, you eliminate duplicate entry, reduce errors, and get an at‑a‑glance view of performance. It’s especially handy for sales managers, account executives, or small‑business owners who need to monitor revenue streams and motivate teams with clear, up‑to‑date numbers.
With this workbook you can track daily transactions, monitor cumulative revenue, and instantly compare actual results against the predefined targets. The automatic summation and variance calculations mean you always know how far you are from the goal, helping you make timely decisions about promotions, resource allocation, or follow‑up actions.
How to use
- Open the Sales Data sheet and enter each sale: client name, date, amount and a brief description. The table will expand automatically.
- Switch to the Targets sheet and type the target amount for the period you’re measuring (e.g., $10,000 for the month).
- Go to the Summary sheet – the totals, variance and progress chart update instantly based on your entries.
- Review the visual summary to see if you’ve met or exceeded the target, and adjust your sales strategy accordingly.
Expected benefits: you’ll spend far less time crunching numbers, enjoy a single source of truth for sales performance, and gain quick insights that keep your team focused on hitting goals.
Similar Templates Recommendation
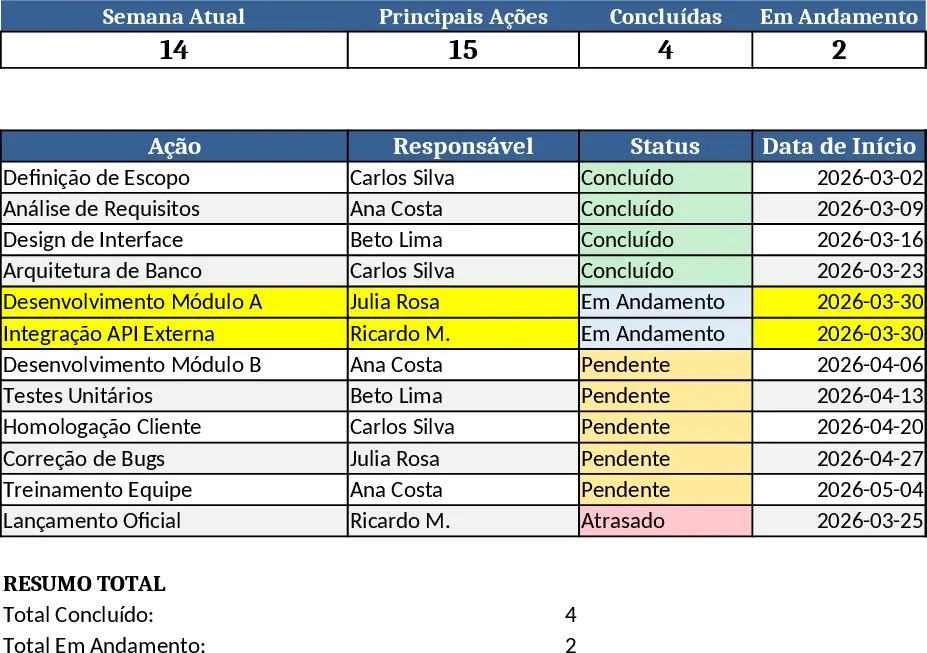
Weekly Timeline Action Report Template
Create a one‑page Excel report that visualizes weekly actions on a timeline, automatically highlighting the current week for quick insights.
Monthly Sales Report Template
A ready‑to‑use Excel template that lets you quickly compile, analyze, and visualize monthly sales data in a professional report.
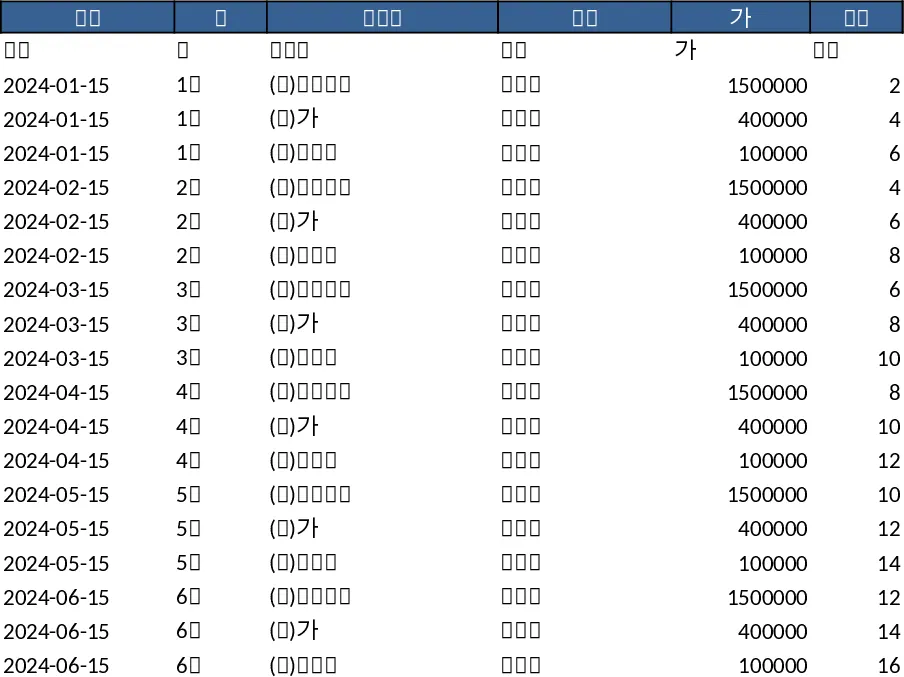
Professional Sales Closing Dashboard Template
A ready‑to‑use Excel dashboard that lets you input monthly sales data and instantly see KPI summaries, trend charts and detailed tables for executive reporting.