Weekly Timeline Action Report Template
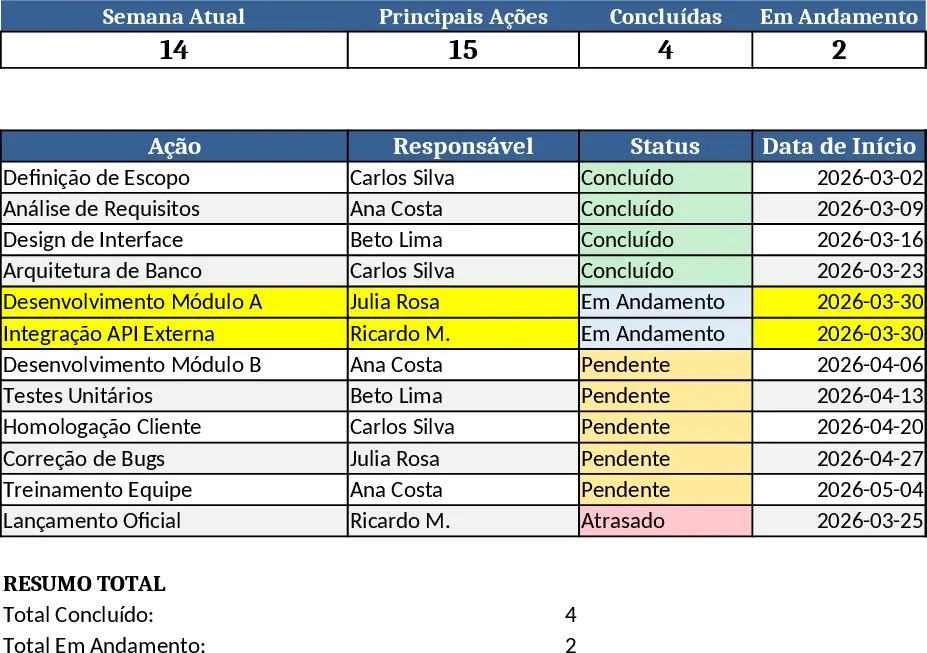
The One‑Page Action Timeline template is built as a three‑sheet workbook. Data Input is where you log every action with columns for Date, Action Description, Owner, Status (Pending, In‑Progress, Completed), Category and optional Comments. A Settings sheet lets you pick the reporting week from a dropdown, define custom status colors, and set optional filters such as department or priority. The Dashboard sheet pulls the data together and generates a compact, printable one‑page view: a horizontal timeline bar that places each action on the correct week, a summary table that aggregates actions by status for the selected week, and conditional formatting that automatically highlights the current week in a bright shade. All calculations are driven by simple formulas and dynamic named ranges, so the report refreshes instantly as you add or edit rows.
This template solves the common pain of assembling weekly status updates from scattered notes or emails. Instead of manually copying data into a presentation, you enter the raw actions once and let the workbook do the heavy lifting. The visual timeline makes it easy to spot bottlenecks, overdue tasks, or upcoming deadlines at a glance, while the highlighted current week draws immediate attention to the most relevant period. By consolidating information in a single, auto‑updating page, teams reduce meeting preparation time, improve alignment, and keep stakeholders informed without endless back‑and‑forth.
The workbook is ideal for project managers, operations supervisors, team leads, and anyone who needs a quick snapshot of weekly activities. It helps track who is responsible for each action, when it is scheduled, its current status, and any relevant notes. The one‑page output is perfect for weekly stand‑up meetings, executive briefings, or email updates, providing a clear, concise picture of progress and upcoming work.
How to use
- Open the Data Input sheet and fill in each action row with the required details.
- Switch to the Settings sheet and select the week you want to focus on; the template will treat this as the "Current Week."
- Go to the Dashboard sheet – the timeline chart, summary table, and highlighted week update automatically.
- Print or export the Dashboard as a PDF for distribution.
Expected benefits: you’ll spend far less time assembling weekly status updates and get a clear visual snapshot in seconds.
Similar Templates Recommendation
Sales Targets Tracker Template
Track sales per client, dates and amounts, compare against set targets, and see total achieved at a glance.
Personal Data Organizer Template
A versatile Excel sheet to organize and view any data you have, with customizable tables, dropdowns, and summary charts.

Monthly Sales Report Template
A ready‑to‑use Excel template that lets you quickly compile, analyze, and visualize monthly sales data in a professional report.