Monthly Budget Tracker with Charts Template
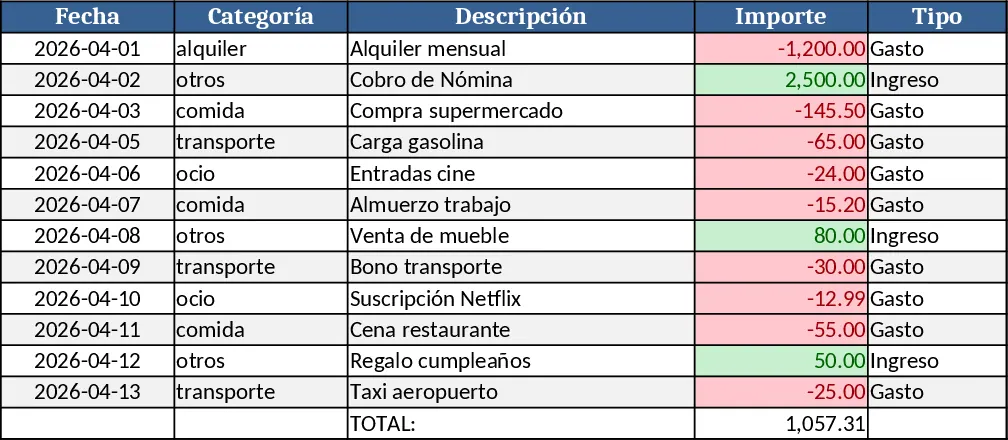
This template is a complete monthly budgeting workbook that lets you record every income source and expense, then instantly turns the data into clear visual summaries. The file is organized into three main sheets: Data Entry, Summary, and Charts. In the Data Entry sheet you log each transaction on a new row, choosing a date, description, amount, and a category from a dropdown list (e.g., Salary, Rent, Utilities, Groceries, Entertainment). The Summary sheet aggregates the data with simple pivot‑style tables that calculate total income, total expenses, and net cash flow for the selected month. The Charts sheet pulls those totals into bar and line graphs, so you can spot trends, compare months, and quickly understand where your money is going.
The workbook solves the common headache of juggling multiple spreadsheets or manual calculations when trying to keep personal or small‑business finances under control. By centralizing all entries and automating the calculations, you eliminate errors, reduce the time spent reconciling accounts, and gain a visual snapshot of your financial health at any moment. It’s especially useful for freelancers, household managers, or small business owners who need a quick, reliable way to monitor cash flow without investing in complex accounting software.
Anyone who wants to stay on top of their money can benefit: individuals planning a household budget, entrepreneurs tracking project‑related income and expenses, or anyone preparing for tax season. The template helps you track daily cash movements, categorize spending, and produce month‑end reports that highlight surplus or deficit, making it easier to adjust spending habits or set realistic savings goals.
How to use
- Open the Data Entry sheet and start filling rows with each transaction: select the date, pick a category from the dropdown, enter a brief description, and type the amount (positive for income, negative for expenses). The sheet automatically validates the amount and prevents blank required fields.
- Switch to the Summary sheet; the totals update instantly. Use the month selector at the top to view different periods, and watch the net cash flow figure change as you add more data.
- Go to the Charts sheet to see bar charts of income vs. expenses and a line graph of net cash flow over the year. Hover over points for exact values and use the built‑in slicer to filter by category if needed.
- At month‑end, export the Summary sheet as PDF or copy the chart to a presentation for stakeholder updates or personal review.
Expected benefits: By automating calculations and providing ready‑made visualizations, the template saves you hours of manual work each month, reduces the risk of entry errors, and gives you a clear picture of your financial position so you can make smarter budgeting decisions.
Similar Templates Recommendation
Couple Budget and Cash Flow Tracker Template
Track monthly income, expenses, and cash flow for a working couple, visualize budgets and savings goals in one spreadsheet.

Monthly Finance Tracker with Emojis and Charts Template
Track monthly income, expenses, fixed and variable costs, mark paid or unpaid items, and view emergency fund, investment and spending charts.
Personal Financial Planning and Savings Tracker Template
A detailed personal finance planner to track income, expenses, savings and hit a 500k goal in 12 months.