Solar Energy Financial & Operations Intelligence Dashboard Template
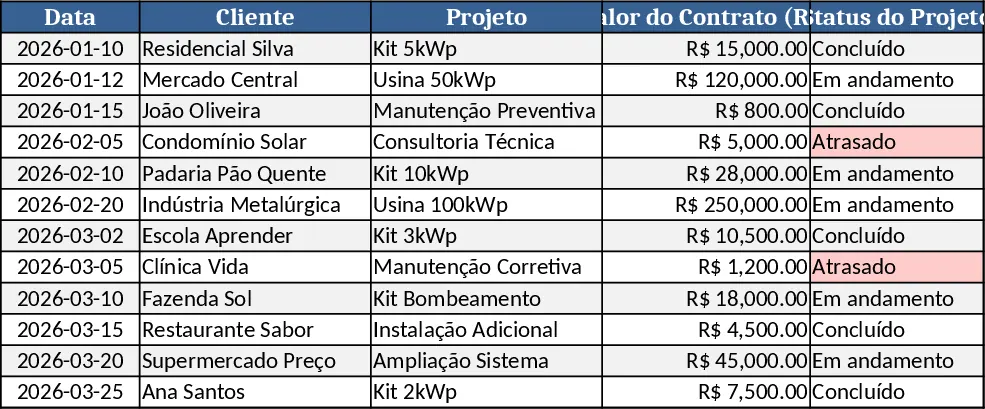
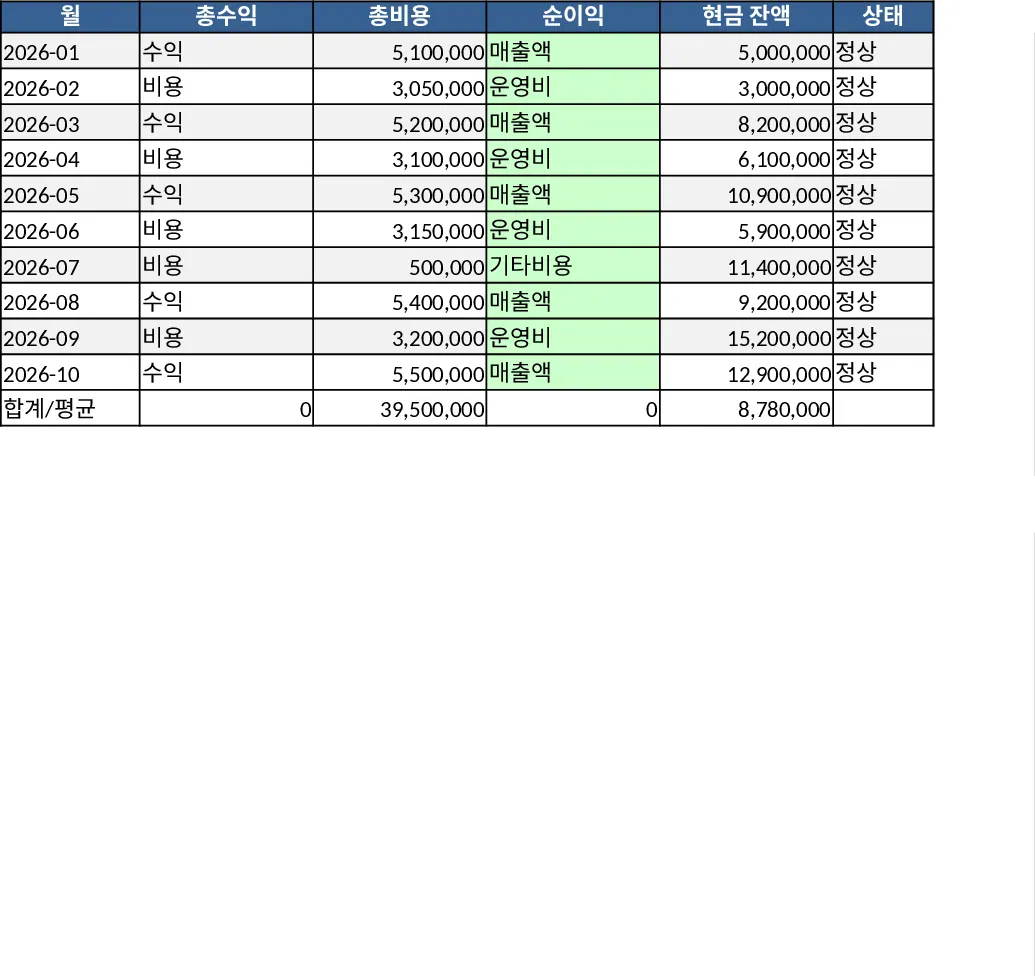
This Excel workbook is organized into three main tabs that together give you a complete picture of your solar‑energy business performance. Base de Dados is a structured table where you record every project with fields such as Date, Client, City, Salesperson, Segment (Residential, Commercial, Rural), Work Status (In progress, Completed, Delayed), Project Value and Project Cost. The table is built as an Excel Table, so it expands automatically as you add rows and supports dynamic formulas. Drop‑down lists enforce consistent entry for Segment and Work Status, while calculated columns compute gross profit and margin on the fly. The second tab, Dashboard, pulls data from the table to display key performance indicators: current month revenue, editable monthly target, previous month revenue, growth percentage, quarterly revenue and target, profit margin, average ticket size, active client count, and number of projects started this month. Visual elements include a line chart of the last three months' revenue, a segment‑wise bar chart, a sales‑person ranking, and a side‑by‑side revenue‑vs‑cost comparison. The third area, Análises Automáticas, uses conditional formulas to flag warning signs – a drop in revenue compared to the prior month, rework costs exceeding 10 % of total cost, or margin falling below a healthy threshold (e.g., 20 %). All visuals use a modern, executive style with soft greens for positive trends and reds for alerts, keeping the layout clean and easy to read.
The template solves the common pain points of fragmented data entry and slow reporting in solar installation firms. By centralizing project financials and automatically generating insightful metrics, you can spot profitability issues, monitor sales performance, and adjust targets without building complex reports from scratch. The instant visual cues help you prioritize actions—whether it’s reallocating resources to delayed projects, coaching under‑performing salespeople, or renegotiating supplier contracts to protect margins. Over time, the dashboard becomes a decision‑making engine, turning raw numbers into strategic insights that support budgeting, forecasting, and growth planning.
Designed for financial controllers, operations managers, and sales directors in solar‑energy companies, this workbook fits any organization that needs to balance technical project execution with robust financial oversight. It tracks revenue streams, cost structures, margin health, client acquisition, and workforce productivity, giving you a single source of truth for both day‑to‑day monitoring and quarterly board presentations.
How to use
- Open the Base de Dados sheet and start entering your projects; use the drop‑downs for Segment and Work Status to keep data clean.
- Update the editable targets on the Dashboard (monthly and quarterly goals) to reflect your current business objectives.
- Watch the KPIs and charts refresh automatically; if any warning indicator lights up in the Análises Automáticas section, investigate the underlying data.
- Export or copy the dashboard view for meetings, or drill down into the table for detailed analysis.
Expected benefits: faster month‑end close, clearer visibility into profit drivers, and reduced manual effort building reports, allowing you to focus on strategic decisions.
Similar Templates Recommendation
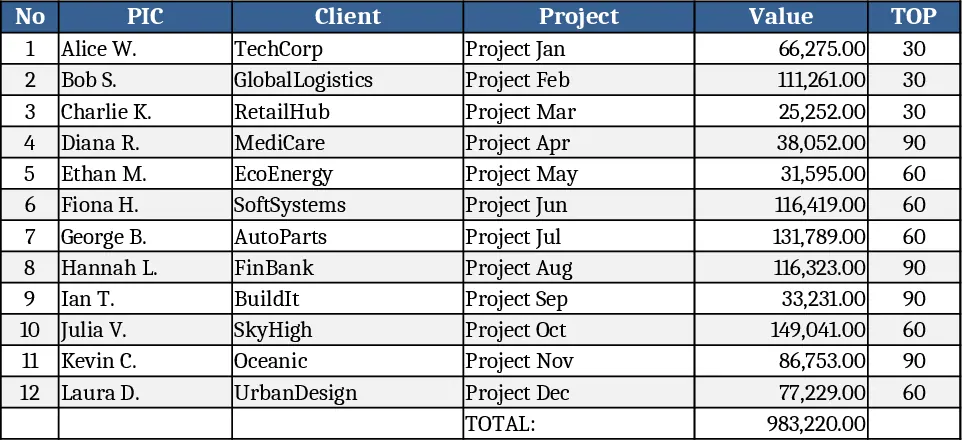
Annual Sales Tracker with Margin & Totals Template
Track and visualize monthly sales performance for the entire year, including client, project, value, margin, and totals.
Professional Sales Closing Dashboard Template
A ready‑to‑use Excel dashboard that lets you input monthly sales data and instantly see KPI summaries, trend charts and detailed tables for executive reporting.
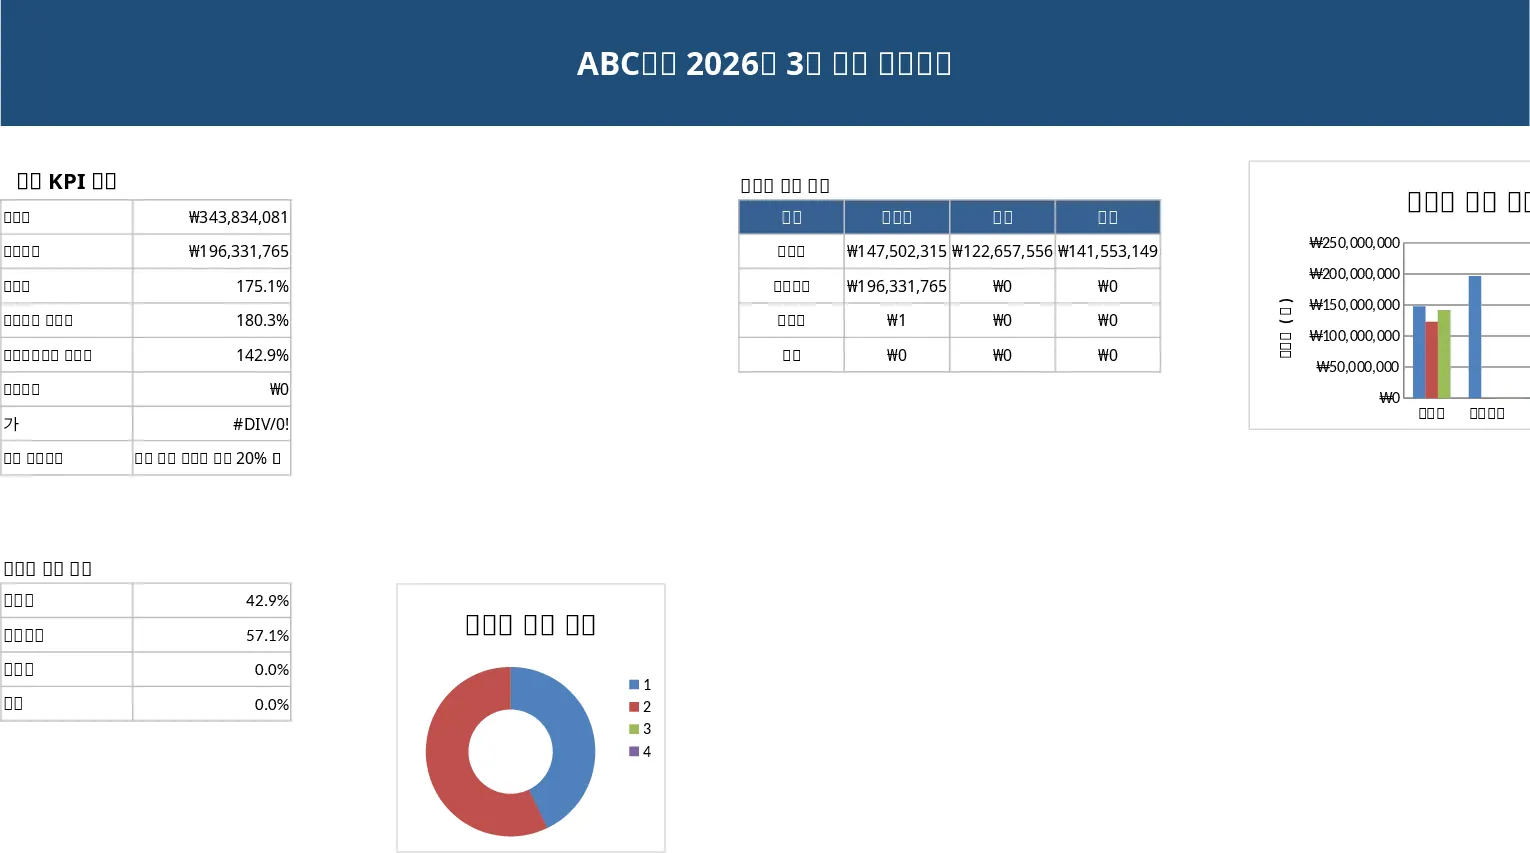
Financial Planning Template
Create a customizable finance template to track budgets, expenses, cash flow and generate summary charts and KPI tables in one spreadsheet.