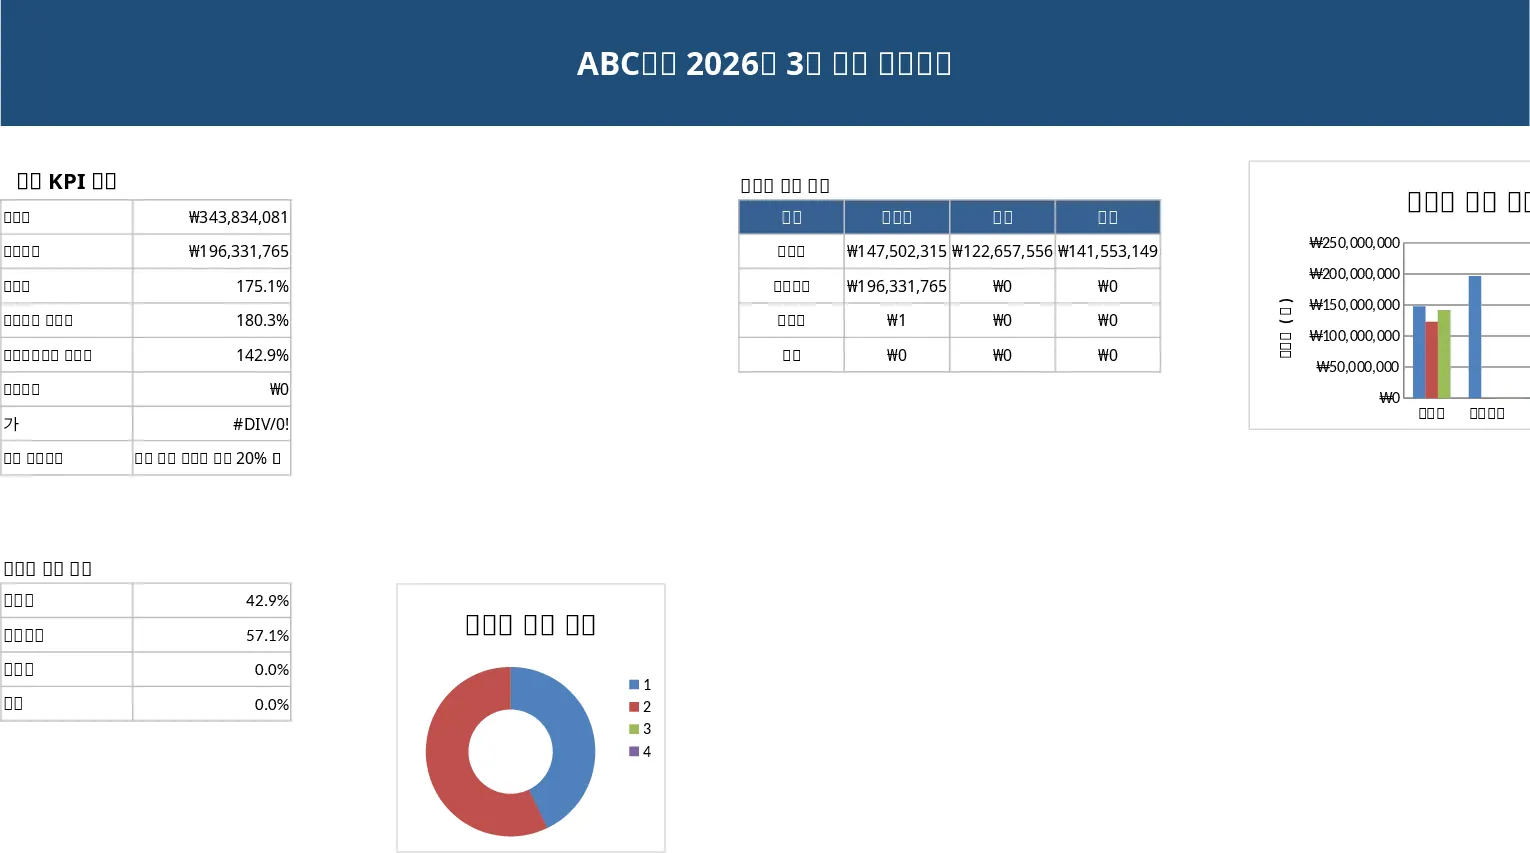
Annual Sales Tracker with Margin & Totals Template
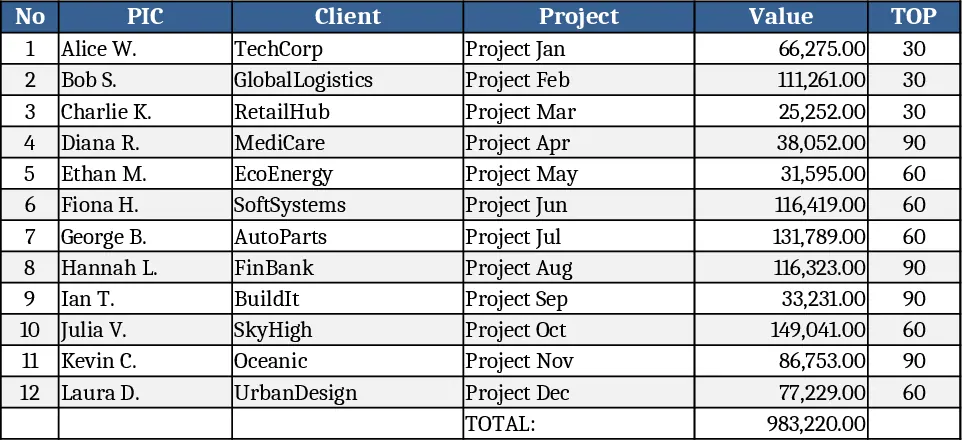
This template is built for a full‑year sales overview, organized on a single worksheet that lists each transaction by No, PIC, Client, Project, Value, TOP, Type, Margin, Margin Value, and the month it belongs to. A drop‑down menu in the Type column lets you classify sales (e.g., New, Renewal, Upsell) while the Monthly column automatically pulls the month from the date you enter. At the bottom of the sheet a Grand Total row aggregates the yearly revenue, total margin, and average margin percentage. A secondary summary sheet pulls these figures into easy‑to‑read tables and charts, showing month‑by‑month trends, top‑performing clients, and profit margins.
The template solves the common headache of consolidating scattered sales data into a single, comparable view. Instead of manually copying numbers from CRM exports or email threads, you simply paste or type the raw data into the input rows. The built‑in formulas calculate monthly subtotals, cumulative totals, and margin ratios instantly, giving you a clear picture of where revenue is growing and where profitability may be slipping. This visibility helps sales leaders set realistic targets, allocate resources to high‑margin projects, and spot seasonal patterns without digging through multiple reports.
Designed for sales managers, account executives, and finance analysts who need a quick, reliable snapshot of yearly performance, the template works best in quarterly business reviews, budget planning sessions, and when preparing executive dashboards. It tracks every sale’s financial impact, from raw value to net margin, and produces summary charts that can be copied into presentations or shared with stakeholders.
How to use
- Open the workbook and go to the "Data Entry" sheet. Fill in each row with the transaction details – the client name, project title, sale value, and margin. Choose the appropriate Type from the drop‑down list.
- Enter the sale date; the template will auto‑populate the Monthly column and update the month‑wise totals.
- Switch to the "Summary" sheet to see automatically generated tables and charts showing monthly revenue, top clients, and overall margin.
- Export the summary charts or copy the tables into PowerPoint or Word for reporting.
Expected benefits: reduces the time spent on manual calculations, improves data accuracy, and provides a ready‑to‑share visual overview of sales performance throughout the year.
Similar Templates Recommendation
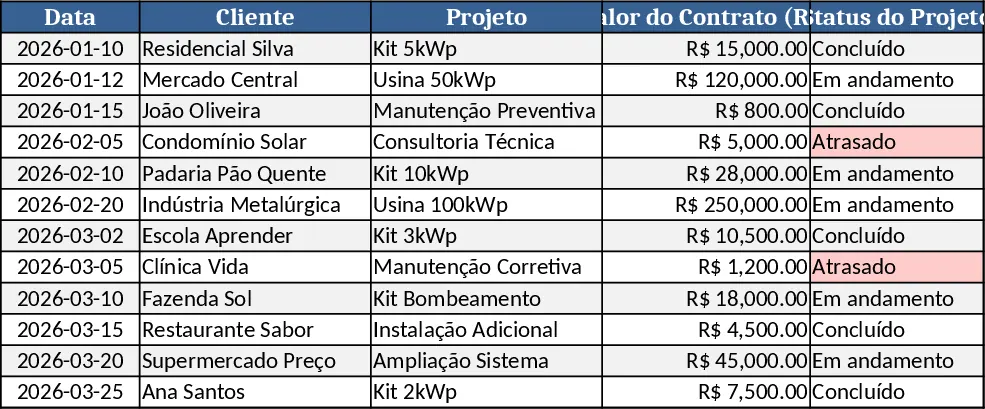
Solar Energy Financial & Operations Intelligence Dashboard Template
Professional Excel template to track and analyze solar energy projects' financials, costs, KPIs, and decision‑making dashboards.
Professional Sales Closing Dashboard Template
A ready‑to‑use Excel dashboard that lets you input monthly sales data and instantly see KPI summaries, trend charts and detailed tables for executive reporting.