Daily Entry Tracker with Monthly View Template
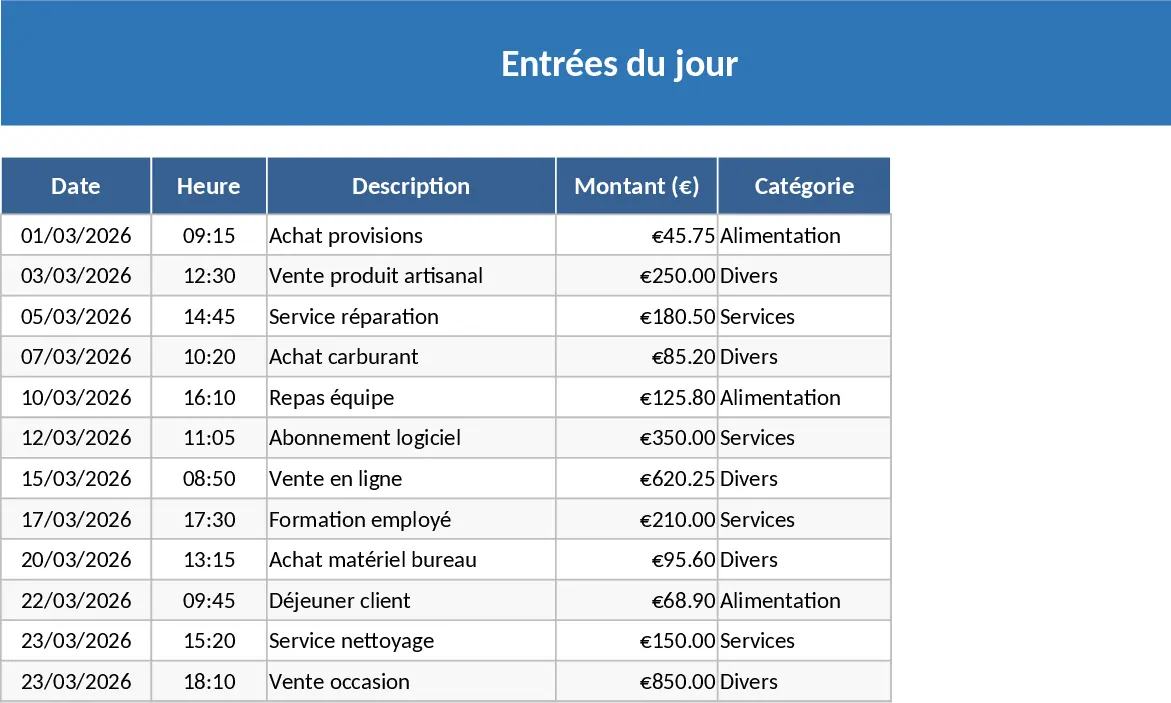
This Excel template is built around three simple sheets – Data Entry, Monthly Summary, and Dashboard. In the Data Entry sheet you record each day's information in a single row, selecting the date, a predefined category from a dropdown, the numeric value (sales, hours, units, etc.) and optional notes. The Monthly Summary sheet pulls those rows with dynamic formulas, grouping them by month and then by day, so you instantly see how each day contributed to the month’s total. The Dashboard sheet visualises the same data with bar and line charts, letting you spot trends at a glance.
The template eliminates the tedious copy‑paste and manual calculations that usually accompany daily logging. By centralising every entry in one place and letting Excel do the aggregation, you avoid transcription errors and get an up‑to‑date monthly picture without extra effort. It’s especially handy when you need to compare daily performance across weeks or identify peak days quickly, turning raw numbers into actionable insight.
Anyone who needs to keep a regular pulse on daily metrics will find this useful – office administrators tracking visitor counts, small‑business owners monitoring daily sales, project coordinators logging hours, or department heads recording daily expenses. The design is generic enough to adapt to any metric that can be quantified per day, yet structured enough to provide consistent reporting.
With this template you can monitor individual daily entries, see cumulative totals for each day of a month, compare month‑over‑month performance, and generate ready‑to‑share charts. The built‑in dropdown ensures consistent categorisation, while conditional formatting highlights unusually high or low values, helping you spot outliers instantly.
How to use:
- Open the workbook and go to the Data Entry sheet. Add a new row for each day, choosing the date, category, value, and any notes.
- The template automatically updates the Monthly Summary sheet – no formulas to edit. Review the table to see daily totals and month‑end aggregates.
- Switch to the Dashboard sheet to view charts that reflect the latest data; the visuals refresh automatically.
- If you need to add new categories, edit the list on the hidden Settings sheet – the dropdown will update across the workbook.
Expected benefits: you’ll spend far less time compiling reports, reduce manual calculation errors, and gain immediate visibility into daily and monthly trends, making decision‑making faster and more reliable.
Similar Templates Recommendation
Vehicle KPI Dashboard and Maintenance Tracker Template
Track each vehicle’s mileage, daily maintenance, fuel usage and monthly KPIs on a dedicated sheet with built-in dashboard and summary.
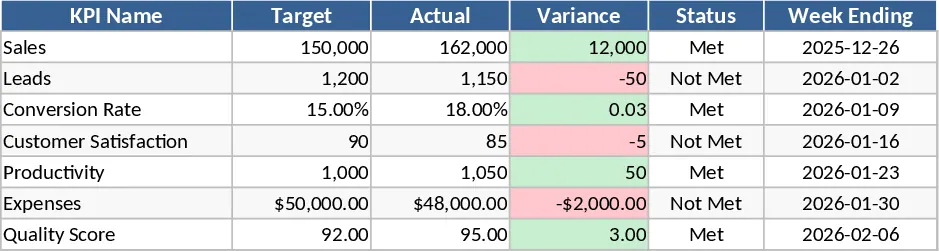
Weekly KPI Tracker Template
Monitor your team's weekly performance metrics and visualize progress against targets with this comprehensive KPI tracking dashboard.