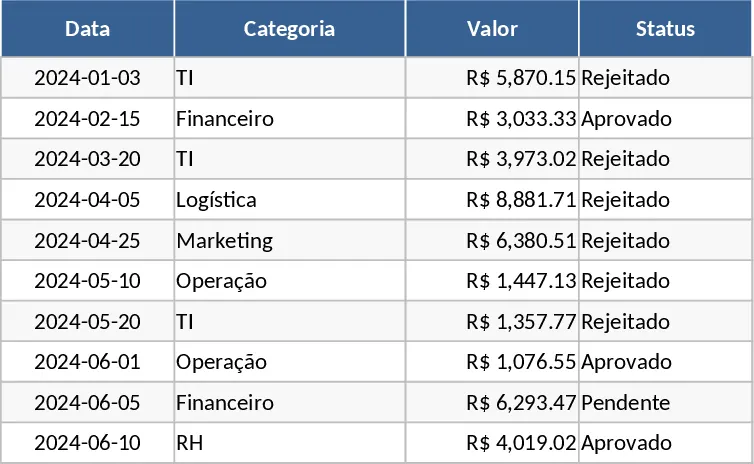
Project Cash Flow & Performance Dashboard Template
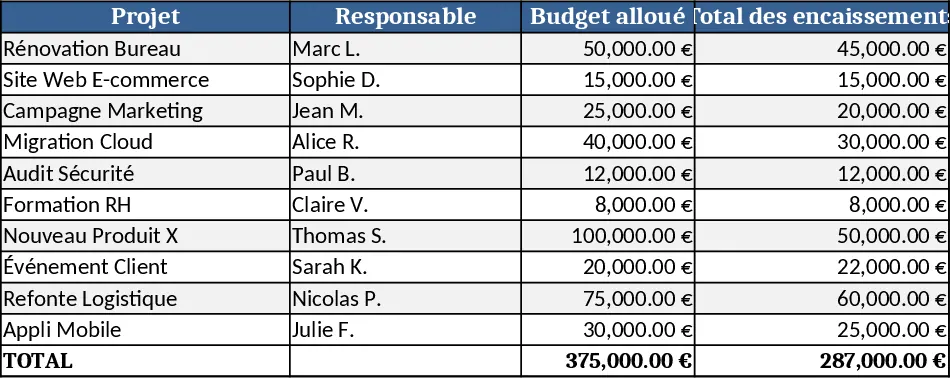
This Excel template provides a complete financial dashboard that consolidates cash‑in, cash‑out and performance metrics for each project you manage. The workbook is split into three sheets: Data Input, Calculations, and Dashboard. In the Data Input sheet you list every project, its start and end dates, budgeted revenue, planned costs and actual cash receipts and payments. Drop‑down menus let you select the project status (Active, Completed, On Hold) and cost categories (Labor, Materials, Overheads, etc.). The Calculations sheet automatically aggregates the raw numbers, computes variances, gross margin, return on investment and other KPIs such as cash conversion cycle and cost‑to‑revenue ratio. All results feed into the Dashboard sheet, where slicers let you filter by project, period or cost type and view charts, tables and sparkline trends at a glance.
The template solves the common headache of juggling multiple project spreadsheets and manual variance checks. By centralising all financial data, you instantly see which projects are over‑budget, where cash is lagging, and which performance indicators are trending up or down. This visibility helps finance teams and project managers make faster, data‑driven decisions, improve cash management and keep stakeholders informed without building a custom BI solution.
Ideal for finance analysts, project controllers, CFOs or anyone who needs to monitor the financial health of a portfolio of projects. Whether you run a construction firm, an IT services company, or a marketing agency handling several campaigns, the dashboard adapts to any industry that tracks project‑level revenue and costs.
How to use
- Open the Data Input sheet and fill in each project’s details: name, dates, budgeted revenue, planned cost categories and actual cash receipts/payments as they occur.
- Choose the appropriate status and cost‑type from the drop‑downs; the template will auto‑populate related formulas.
- Switch to the Dashboard sheet, use the slicers to filter by project or month, and watch the charts update in real time.
- Export the dashboard view to PDF or copy it into presentations to share insights with senior management.
Expected benefits include a noticeable reduction in time spent consolidating financial data, fewer manual errors, and clearer insight into project profitability that supports quicker corrective actions.
Similar Templates Recommendation
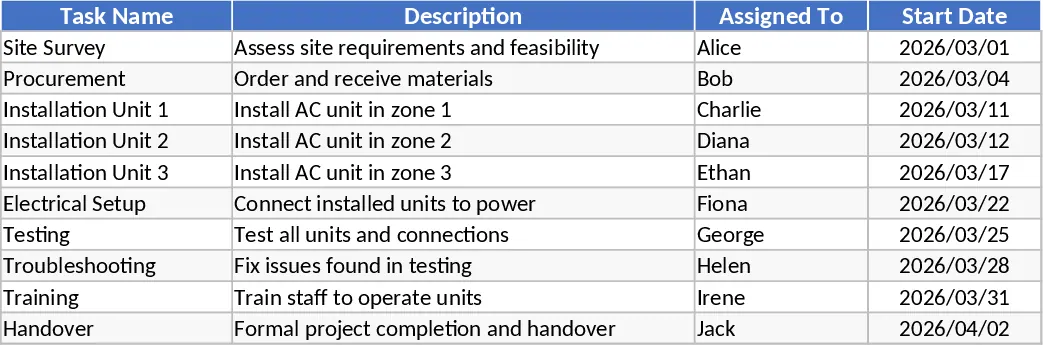
Project Expense and Profit Dashboard Template
Track project budgets, actual costs, and profit margins in real-time with this comprehensive dashboard designed for financial oversight.
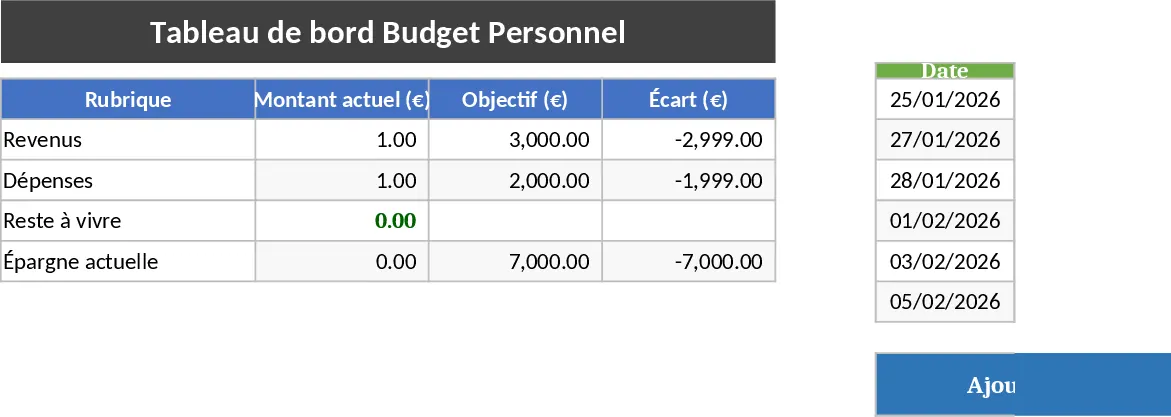
Personal Monthly Budget and Savings Dashboard Template
Manage monthly income, expenses, and savings with a professional dashboard featuring automated summaries and category-based filtering.
Comprehensive Project Financial Control and KPI Dashboard Template
Track project budgets, expenses, and revenues with automated dashboards, KPI cards, and specialized action-tracking sheets.