

2026 Business Performance Instagram & YouTube Dashboard Template
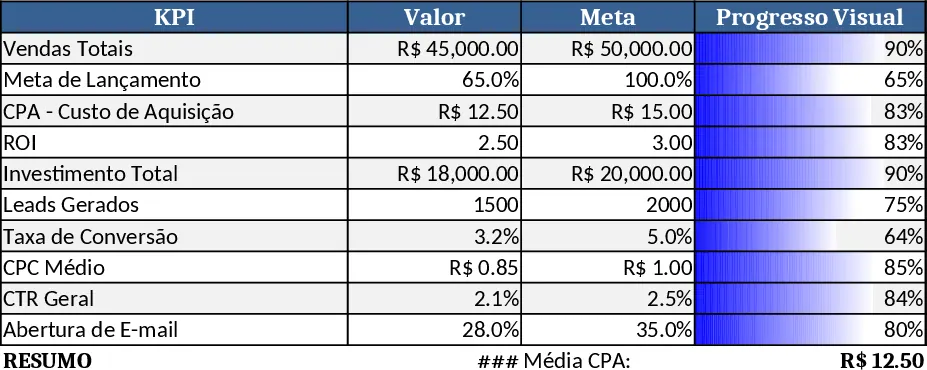
The 2026 Sales & Engagement Metrics Dashboard is built on three worksheets. The Header Global sheet shows the overall financial snapshot – total sales, launch‑goal progress, and average cost per acquisition (CPA). The Instagram sheet breaks down short‑form content performance with click‑throughs, conversion rate, daily reach, story/reel interactions, and an AI‑driven recommendation for the next post. The YouTube sheet captures long‑form authority metrics such as cumulative views, new subscribers, average watch time, link clicks, and sales generated from video descriptions, plus a status indicator of YouTube’s recommendation algorithm.
This template solves the common problem of scattered data sources by consolidating all key performance indicators into a single, easy‑to‑read visual layout. Marketers and product launch managers can instantly see whether the launch budget is delivering ROI, which platform is driving the most qualified traffic, and where to focus creative effort next. The side‑by‑side view of Instagram’s rapid‑fire engagement and YouTube’s long‑tail authority helps balance short‑term conversion tactics with brand‑building strategies.
Who benefits – digital marketers, growth hackers, e‑commerce managers, and small‑business owners running multi‑channel campaigns. It is ideal for weekly or daily launch reviews, stakeholder updates, and data‑driven decision making during a product rollout.
How to use
- Step 1: Open the Header Global tab and enter the latest total sales, target percentage, and CPA values. The summary cards update automatically.
- Step 2: Populate the Instagram tab with yesterday’s and today’s link clicks, conversion numbers, story/reel reach, sticker clicks, and DM responses. The funnel bar and sparkline will reflect the trend.
- Step 3: Fill the YouTube tab with 28‑day view totals, new subscriber count, average retention minutes, description‑link clicks, and sales figures. The recommendation circle will turn green when the algorithm is favoring your videos.
- Step 4: Review the combined visual dashboard at the top of the workbook; the bars, gauges, and charts give a real‑time health check of the launch.
Expected benefits: a clearer picture of channel performance, faster identification of high‑impact content, and reduced time spent gathering numbers from separate analytics tools.
Similar Templates Recommendation
Secondary School Results and Ranking Template
Track up to 200 secondary students' marks, auto‑calculate grades, averages, divisions and rankings in a clear, formatted sheet.

Couple Budget and Cash Flow Tracker Template
Track monthly income, expenses, and cash flow for a working couple, visualize budgets and savings goals in one spreadsheet.

Date Range and Internal Log Template
Create an Excel file with two columns for dates and internal notes, with colored rows for different date ranges.
