

Restaurant Table Sales Tracking Template
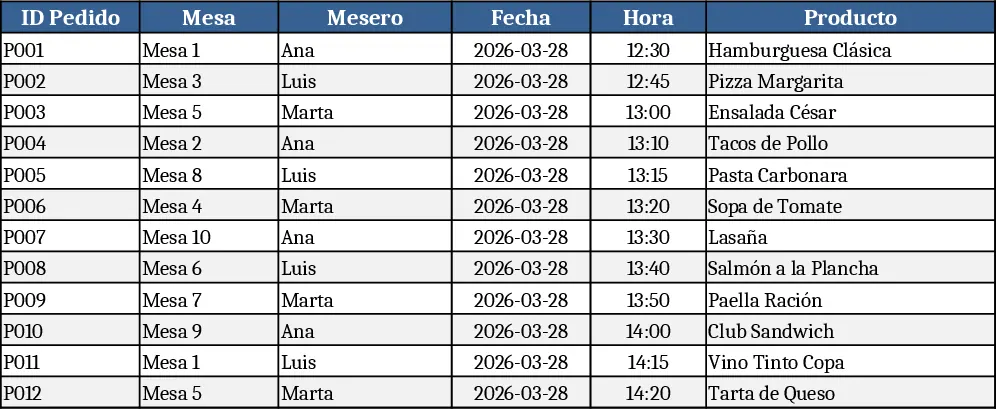
This template is organized into three main sheets – Orders, Tables, and Summary. In the Orders sheet you record each transaction with fields such as Date, Shift (breakfast, lunch, dinner), Table Number, Server, Menu Item, Quantity, Unit Price, and Total. Dropdown lists let you pick the shift, server name, and menu categories, ensuring consistent data entry. The Tables sheet logs which tables are occupied, the time they were seated, and when they were cleared, allowing you to calculate turnover rates. The Summary sheet pulls data from the other sheets and automatically generates key metrics: total sales per shift, average check size, most‑sold dishes, and table turnover percentages, all displayed in easy‑to‑read tables and charts.
Designed for restaurant owners, managers, and floor supervisors, this spreadsheet solves the common headache of manually tallying sales and tracking table usage. By consolidating order entry and seating information in one place, you can instantly see which shifts are most profitable, which menu items drive revenue, and how efficiently tables are being turned. This insight helps you schedule staff more effectively, adjust menu pricing, and improve overall service speed without needing a complex POS system.
The template helps you manage daily sales, monitor table turnover, and produce concise performance reports that can be shared with staff or used for weekly reviews. It eliminates the need for separate spreadsheets or paper logs, reducing errors and saving the time you’d spend consolidating data at the end of each day.
How to use
- Open the Orders sheet and enter each order as it occurs, selecting the appropriate shift, server, and menu item from the dropdowns. The Total column calculates automatically.
- Switch to the Tables sheet to mark a table as occupied when guests are seated and as cleared when they leave; the sheet records timestamps for each status change.
- Review the Summary sheet – it updates in real time, showing total sales, average ticket, top‑selling items, and table turnover for the selected date range.
- Export or print the Summary report for staff meetings or management reviews.
Expected benefits include faster end‑of‑day reconciliation, clearer visibility into peak service periods, and more informed decisions about staffing and menu planning.
Similar Templates Recommendation
Secondary School Results and Ranking Template
Track up to 200 secondary students' marks, auto‑calculate grades, averages, divisions and rankings in a clear, formatted sheet.

Couple Budget and Cash Flow Tracker Template
Track monthly income, expenses, and cash flow for a working couple, visualize budgets and savings goals in one spreadsheet.

Date Range and Internal Log Template
Create an Excel file with two columns for dates and internal notes, with colored rows for different date ranges.
